Fig. 6.
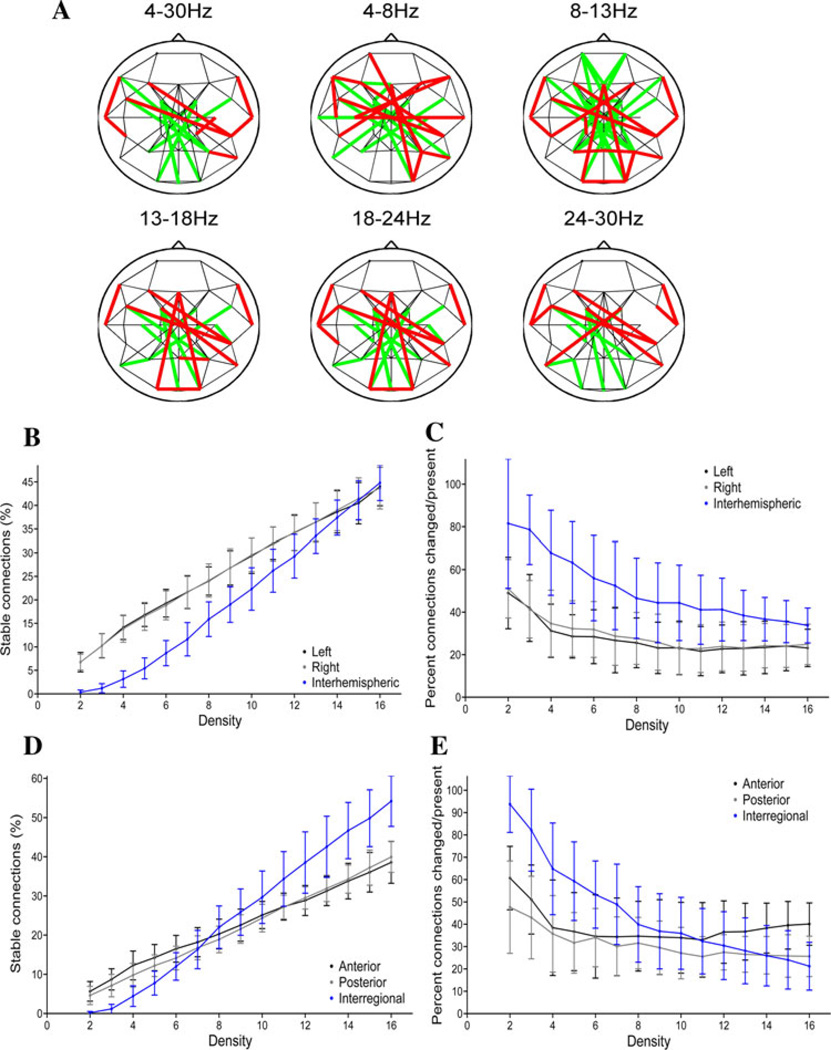
Network topologies and cTBSin fixed-density networks. a Fixed-density networks for the average (across-subject) lagged max covariance data in different frequency bands. These graphs are constructed by applying a threshold to produce networks with a mean nodal connectivity degree of four (an average of four connections per node), with thresholds set independently in both the pre-cTBS and post-cTBS periods. Connections present both pre- and post-cTBS are depicted in black, connections present only prior to cTBS in green, and connections present only after cTBS are shown in red. b The percentage of broad-band connections that are present and stable (present both before and after rTMS) as a function of hemisphere and density. c The broad-band modulation index (percent of connections modified/percentage of connections present in either or both periods) as a function of hemisphere and density. d The percentage of broad-band connections that are present and stable as a function of region and density. e The broad-band modulation index as a function of region and density

