Fig. 8.
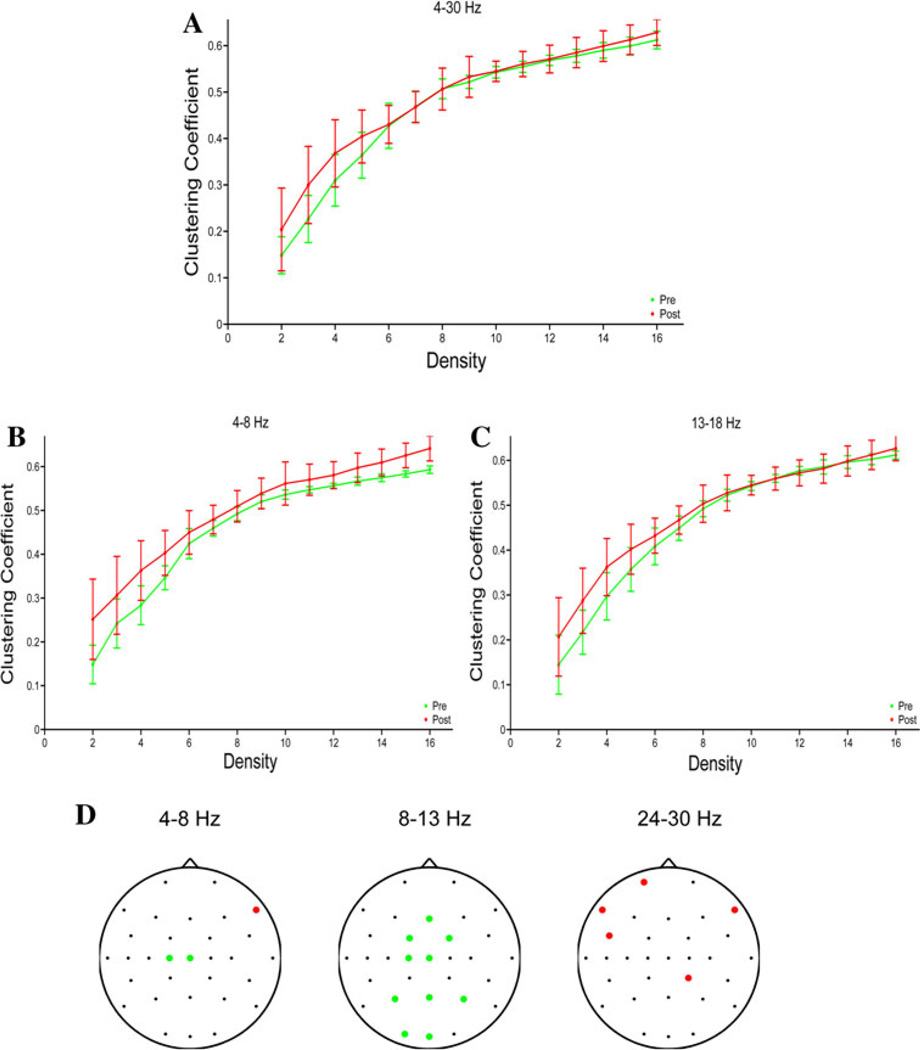
Graph theory metrics. a Clustering coefficient pre- and post-cTBS as a function of density in the broad band in the fixed-density networks. b Clustering coefficient in the theta band in the fixed-density networks. c Clustering coefficient in the in the low-beta band in the fixed-density networks. d Channels with significant changes in node degree after cTBS in the variable-density networks. The green dots indicate electrodes with a significant decrease in node degree after rTMS, while the red dots indicate electrodes with a significant increase in node degree. No significant changes were seen in other frequency bands

