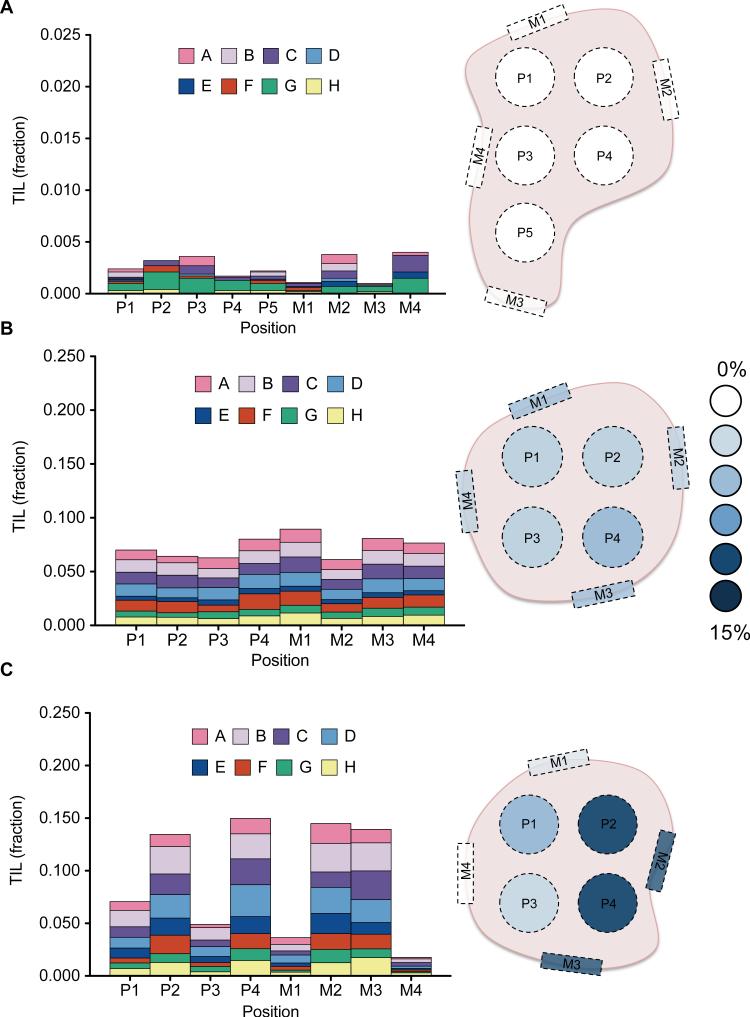
Figure 3.
Spatial characterization of TILs in primary ovarian carcinoma. To assess the heterogeneity of TIL frequency and profile throughout a tumor, a two-dimensional lattice was made for slices of primary tumors from 3 patients (a,b,c), with punch biopsies taken at one cm intervals from the interior (P) and margins (M), as indicated in the diagrams. DNA was isolated, and digital TIL quantification was performed for each biopsy. (a) In patient 1, a consistently low TIL fraction (< 0.5%) was observed across all biopsies. (b) Patient 2 displayed higher, but similarly homogenous TIL frequencies (6 – 8%). (c) Patient 3, however, showed a high degree of variability between biopsies, ranging from 2 to 15% TILs. Plotting these TIL fractions on the tumor diagram reveals that the biopsies with higher TIL fractions were all from one side, and the biopsies with lower TIL fractions were from the other.

