FIGURE 7.
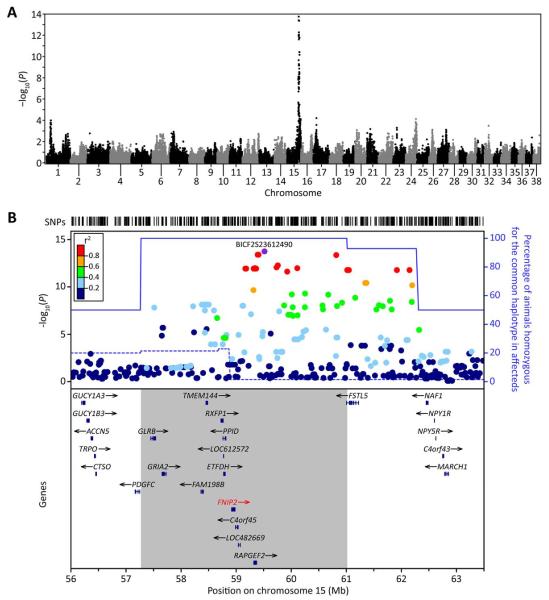
Genome-wide association maps disease gene to chromosome 15. (A) Manhattan plot of −log10-transformed P values obtained upon GWA analysis of genotypes at 95,990 autosomal SNPs in the 84 Weimaraner samples. A single peak is evident on chromosome 15q with the most strongly associated SNP at 59,514,062 bp (BICF2S23612490, P = 1.79 × 10⁻¹⁴). (B) Locuszoom plot (Pruim et al., 2010) of critical interval on chromosome 15q and candidate genes within the interval. Top, −log10-transformed P values at individual SNPs colored by the strength of their correlation (r2) with the most significant SNP in the region (BICF2S23612490, colored purple). Also shown are the proportion of affected (solid blue line) and unaffected (dashed blue line) animals that were homozygous for the common haplotype in affected animals. Bottom, genes in the region, with the 3.75 Mb region in which all affected animals are homozygous for a single haplotype shown by the grey box and the gene containing the causal mutation is identified in red. Pairwise r2 were estimated using unrelated unaffected animals only. [Color figure can be viewed in the online issue, which is available at wileyonlinelibrary.com.]

