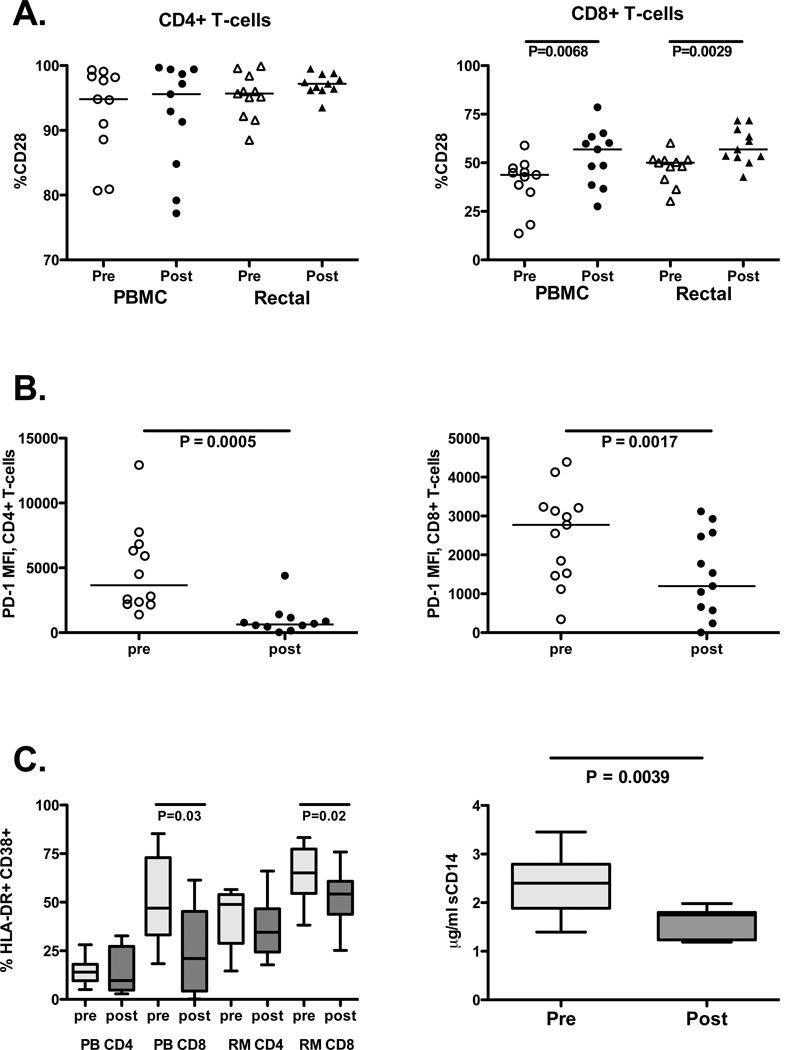
Figure 3. Effects of HAART on costimulatory molecules and immune activation markers.
(A) CD28 expression pre and post-HAART in CD4+ (left) and CD8+ T-cells (right) in PBMC and rectal mucosa. Open shapes indicate pre-HAART values; closed shapes indicate post-HAART values. Horizontal lines indicate median values. P values were determined by and Wilcoxon signed rank test. (B) Median fluorescence intensity (MFI) of PD-1 on IFNγ-producing, Gag-specific CD4+ (left) and CD8+ T-cells (right) in PBMC. Lines indicate median values. P values were determined by Wilcoxon signed rank test. (C) Immune activation markers. Left: CD4+ and CD8+ T-cells in PBMC (PB) and rectal mucosa (RM) co-expressing HLA-DR and CD38. Box plots indicate interquartile ranges, with lines at the median. Pale gray boxes indicate pre-HAART; dark boxes indicate post-HAART values. Right: Plasma sCD14 concentrations pre- and post-HAART (interquartile ranges, with lines at the median). P values were determined by Wilcoxon test.

