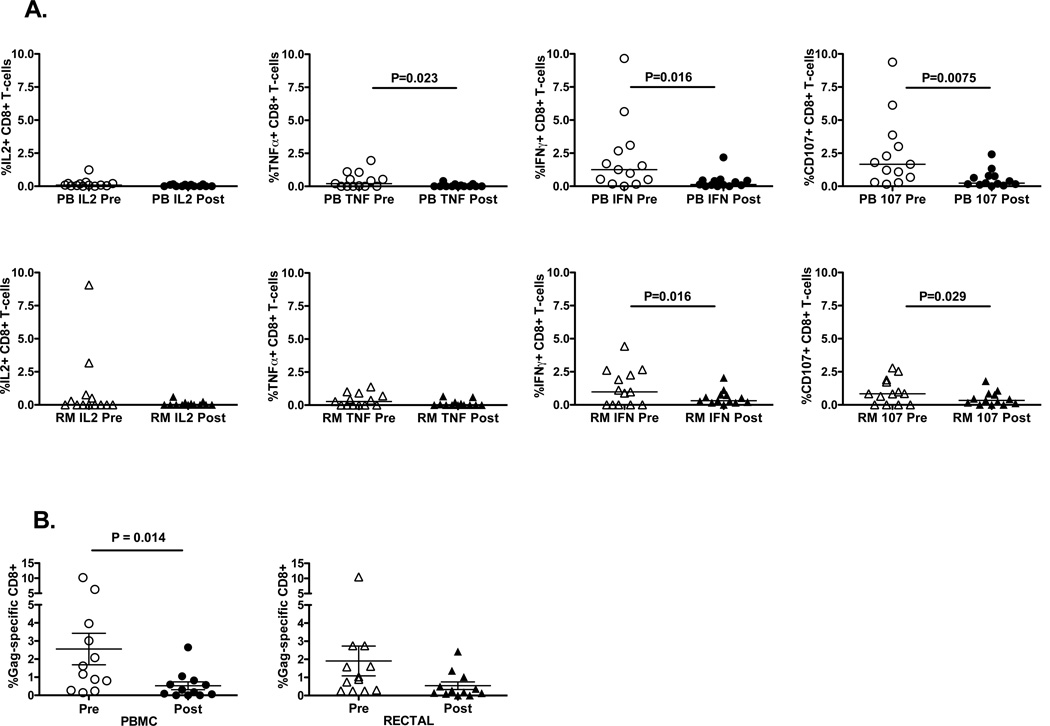
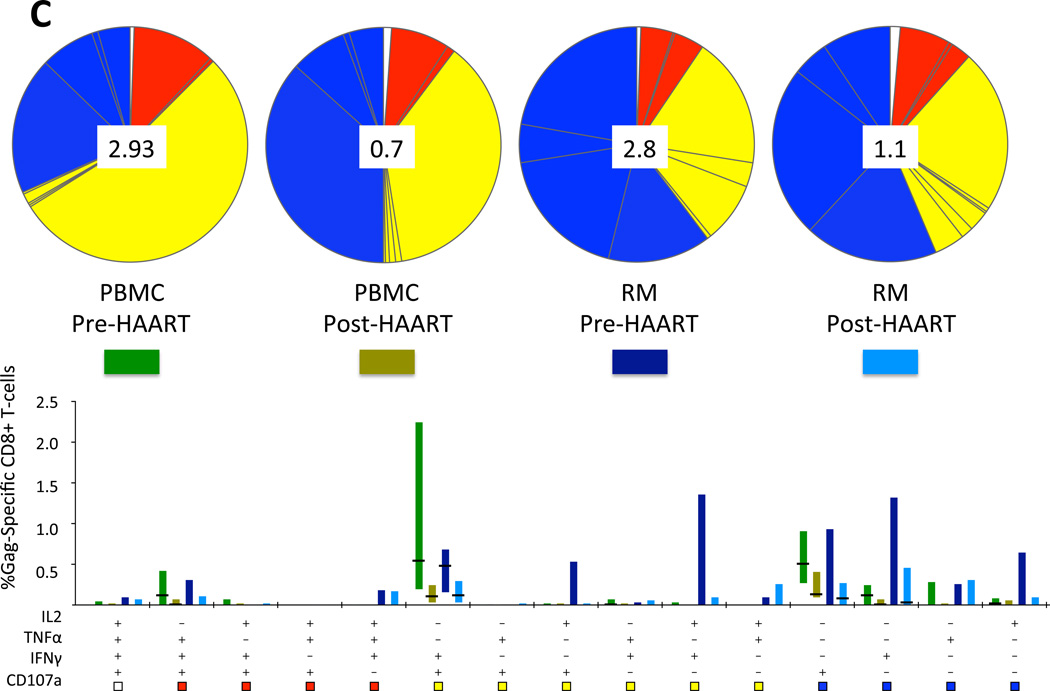
Figure 4. HIV-specific T-cell responses decline during HAART.
(A) HIV Gag-specific CD8+ T-cell responses in PBMC (PB) and rectal mucosa (RM) pre- and post-HAART, showing individual factors (IL-2, TNF-α, IFN-γ, CD107) produced in response to Gag peptide stimulation. Pale gray boxes indicate pre-HAART; dark boxes indicate post-HAART values. (B) Total Gag-specific CD8+ T-cell response in PBMC (PB) and rectal mucosa (RM), pre- and post-HAART, when all non-overlapping responses are combined. P values were determined by Wilcoxon test. (C) Polyfunctionality of CD8+ T-cell responses to HIV Gag peptides. The percentage value shown in the center of each pie diagram denotes the total percentage of CD8+ T-cells responding in any way to Gag peptide stimulation. Individual color-coded pie slices represent the fraction of cells within the total responding population displaying 4 (white), 3 (red), 2 (yellow), or 1 (blue) function(s), beginning at the top of each pie and moving clock-wise, as compiled from the bar graph data. The bar graph provides fine detail on frequencies within each of the individual 15 categories. Individual bars are color-coded in bright green (PBMC, pre-HAART), avocado (PBMC, post-HAART), dark blue (Rectal Mucosa, pre-HAART), or aqua (Rectal Mucosa, post-HAART). Bar heights show interquartile ranges (25%–75%), with horizontal black lines indicating median values.


