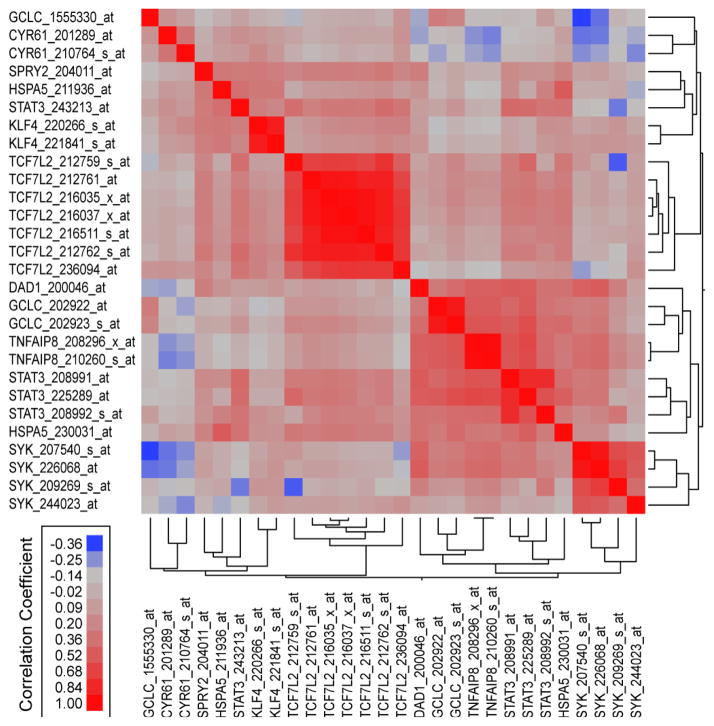
Figure 2.
Correlations of the SYK Gene Signature in B/T-lineage Acute Lymphoblastic Leukemia Patients with SYK and STAT3 expression using the RMA Normalized Database obtained from 3 studies. Publically available gene expression datasets from 3 studies examining newly diagnosed B-lineage ALL (GSE1187 (N = 207), GSE13159 (N = 575), GSE13351 (N = 92)) and newly diagnosed T-lineage ALL (GSE13159 (N = 174), GSE13351 (N = 15)) were normalized using Robust Multi-array Averaging (RMA) method to compare expression profiles of SYK, STAT3 and SYK dependent STAT3 (KLF4, SPRY2, CYR61) and anti-apoptotic pathways (DAD1, GCLC, HSPA5, TCF7L2, TNFAIP-8). Pairwise correlations (Pearson coefficients) were performed for 28 probesets using the RMA normalized database. Correlation coefficients (r) were determined between all probeset pairs and two-way hierarchical agglomerative cluster analysis was applied to the matrix of correlation coefficients for both rows and columns of probeset identifications using the average distance metric to organize correlated expression profiles. Highly significant (P < 0.00001) correlations were observed for 234 out of the 378 possible pairs for probesets representing SYK, STAT3, and SYK/STAT3 target genes. Majority of these highly significant correlations were probesets that exhibited positive correlations versus negative correlations between these probesets (192 positive correlations, 42 negative correlations).

