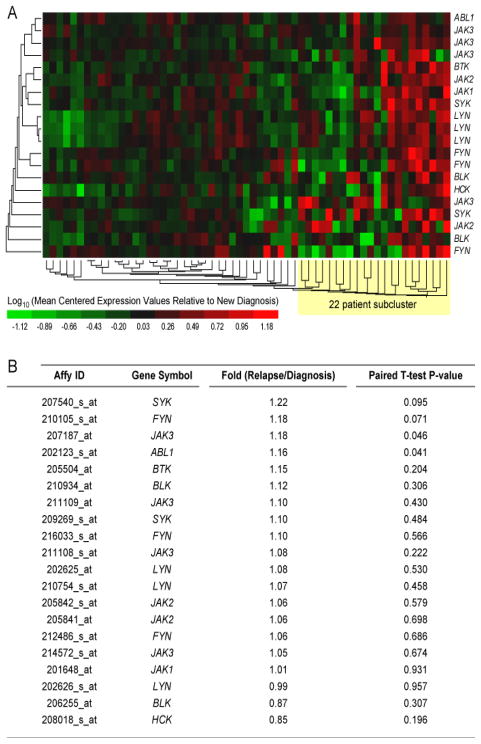
Figure 4.
Kinase Gene Expression Profiles of Primary Leukemic Cells from Matched Pair Relapse vs. Diagnostic Bone Marrow Specimens of B-precursor ALL Patients. Gene expression values for leukemic cells in matched pair specimens taken from 59 BPL patients at diagnosis and then at relapse (combined from GSE3912, N = 32 and GSE 18497, N = 27). RMA-normalized values for the GSE18497 dataset and the MAS5-Signal intensity values for the GSE3912 dataset were log10 transformed and mean centered to the average value for the diagnosis samples for each gene transcript in each study. A two-way agglomerative hierarchical clustering technique was used to organize expression patterns using the average distance linkage method such that genes (rows) having similar expression across patients and patients with similar gene expression profiles were grouped together (average distance metric). The heat map represents the color-coded expression value for 59 matched pair diagnostic and relapse samples reported as the mean centered expression value relative to log10 transformed diagnostic samples.

