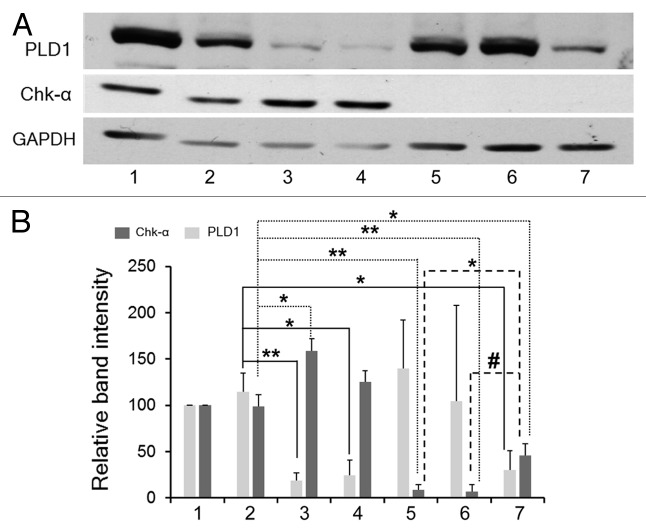
Figure 3. (A) Representative immunoblots of Chk-α and PLD1 in MDA-MB-231 cells: untreated (1), treated with 25 nM PLD1-siRNA (3), 100 nM PLD1-siRNA (4), 75 nM Chk-α-siRNA (5), 100 nM Chk-α-siRNA (6), and 25 nM PLD1-siRNA + 75 nM Chk-α-siRNA (7). Cells treated with 100 nM control siRNA (2) were used as negative controls. (B) Relative band intensity for Chk-α and PLD1 as compared with GAPDH was calculated after the treatment of MDA-MB-231 cells (n = 3–6 per group) with 25 nM PLD1-siRNA (4), 100 nM PLD1-siRNA (5), 75 nM Chk-α-siRNA (6), 100 nM Chk-α-siRNA (7), and 25 nM PLD1-siRNA + 75 nM Chk-α-siRNA (8). Cells treated with 100 nM control siRNA (3) were used for comparison. Values represent mean + SE, #P < 0.06, *P ≤ 0.05, **P ≤ 0.01 (one-tailed unpaired t test), compared with control siRNA treated cells (2).

An official website of the United States government
Here's how you know
Official websites use .gov
A
.gov website belongs to an official
government organization in the United States.
Secure .gov websites use HTTPS
A lock (
) or https:// means you've safely
connected to the .gov website. Share sensitive
information only on official, secure websites.
