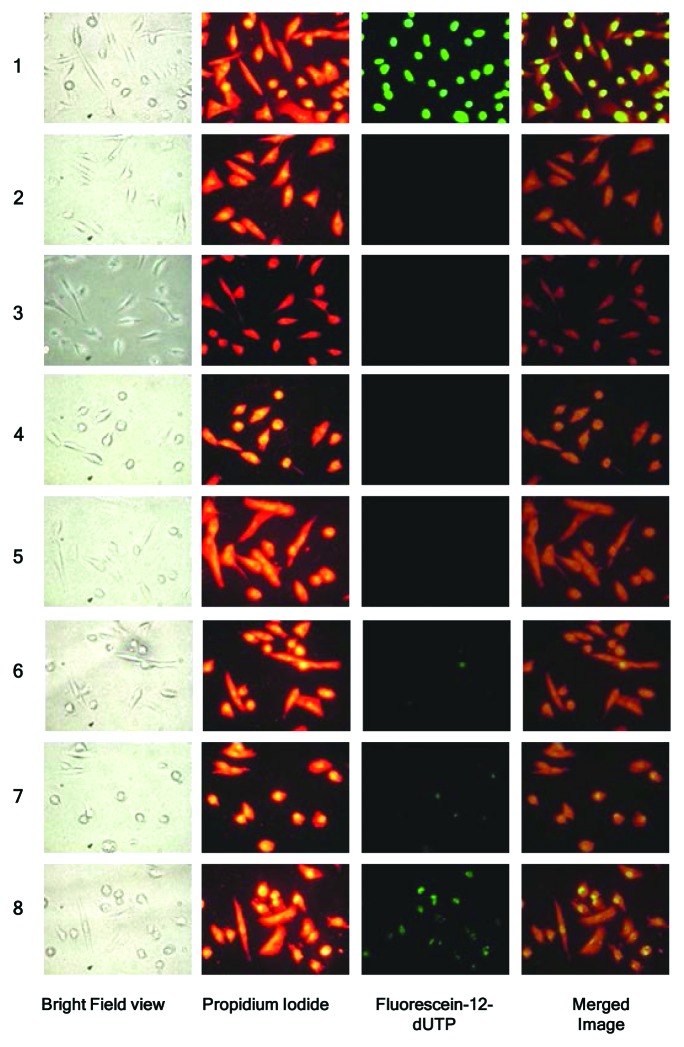
Figure 4. Representative images of TUNEL assay performed in MDA-MB-231 cells (n = 5 per group) after transfection with: 25 nM PLD1-siRNA (4), 100 nM PLD1-siRNA (5), 75 nM Chk-α-siRNA (6), 100 nM Chk-α-siRNA (7), and 25 nM PLD1-siRNA + 75 nM Chk-α-siRNA (8). MDA-MB-231 cells were treated with DNase I (1) as a positive control while untreated (2) and 100 nM control siRNA (3) treated samples served as negative controls. Panels from left to right represent a bright field view of the cells taken with a 40× objective, propidium iodide staining (red), incorporation of fluorescein-12-dUTP (green), and a merged image of propidium iodide and fluorescein-12-UTP incorporation. Propidium iodide staining represents the total number of cells in the panel while the intensity of fluorescein is indicative of the number of double strand breaks in DNA. Multiple images with the same acquisition parameters were taken from each sample to represent the entire sample.

An official website of the United States government
Here's how you know
Official websites use .gov
A
.gov website belongs to an official
government organization in the United States.
Secure .gov websites use HTTPS
A lock (
) or https:// means you've safely
connected to the .gov website. Share sensitive
information only on official, secure websites.
