
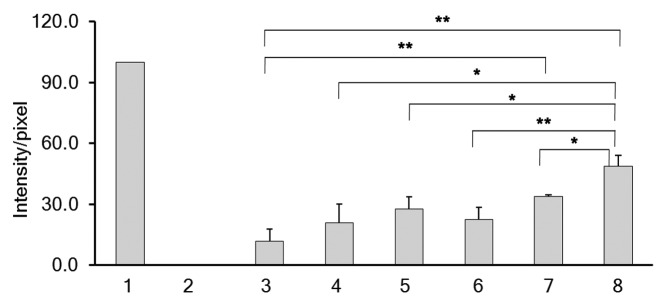
Figure 5. Images obtained from the TUNEL assay were quantified using MATLAB software as described in Materials and Methods and intensity/pixel values were calculated. The intensity/pixel were obtained for samples (n = 5) following transfection with 25 nM PLD1-siRNA (4), 100 nM PLD1-siRNA (5), 75 nM Chk-α-siRNA (6), 100 nM Chk-α-siRNA (7), and 25 nM PLD1-siRNA + 75 nM Chk-α-siRNA (8) in MDA-MB-231 cells. MDA-MB-231 cells were treated with DNase I (1) as a positive control while untreated (2) and 100 nM control siRNA (3) treated samples were considered as negative controls. Values represent mean + SE, *P ≤ 0.05, **P ≤ 0.01, ***P ≤ 0.001.