
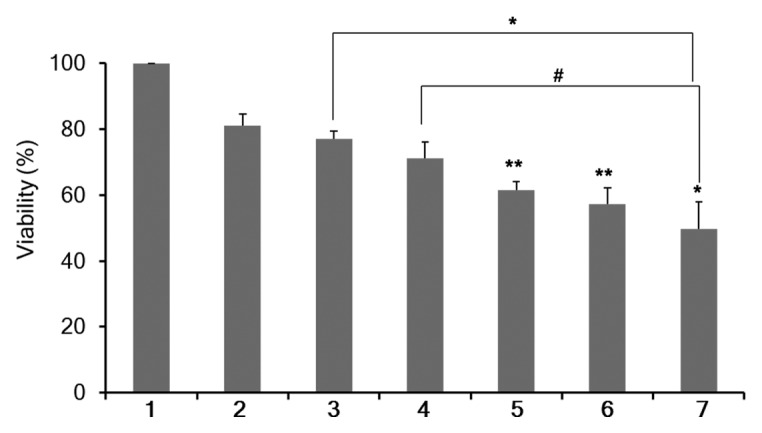
Figure 6. Percent cell viability/proliferation (%) as determined by MTS assay in MDA-MB-231 cells (n = 4 per group). MTS assays were performed 3 d after 48 h of treatment with Dfect (1), 100 nM control siRNA (2), 25 nM PLD1-siRNA (3), 100 nM PLD1-siRNA (4), 75 nM Chk-α-siRNA (5), 100 nM Chk-α-siRNA (6), and 25 nM PLD1-siRNA + 75 nM Chk-α-siRNA (7). Values represent mean + SE, #P < 0.075, *P ≤ 0.05, **P ≤ 0.01, compared with control siRNA treated cells unless otherwise indicated.