
Figure 1. Heart rate characteristics monitor screen shots showing normal HRC and abnormal HRC in a patient with NEC.
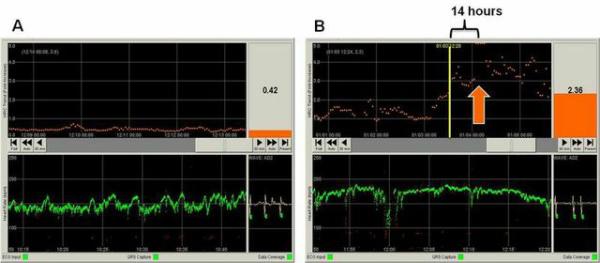
A) HRC monitor screen for an individual patient with normal heart rate characteristics. The bottom panel shows the last 30 minutes of heart rate (green) with a baseline HR of 150 beats per minute and normal frequent small accelerations and decelerations. The top panel shows the 5-day trend in the HRC index, which is derived from measures of heart rate variability and repetitive decelerations and is the probability the patient will be diagnosed with sepsis in the next 24 hours. In this patient, the HRC index has been low (<1) for 5 days indicating normal HRC and low probability of sepsis. The current HRC index is displayed in the upper right corner (0.42). B) HRC monitor screen for a patient with necrotizing enterocolitis and E. coli bacteremia. The time of clinical diagnosis of NEC is indicated by the orange arrow, at which time the HRC index was >5. Fourteen hours before NEC diagnosis (yellow vertical line) the HRC index had risen to 2.36 reflecting decreased accelerations and transient decelerations as seen in the corresponding HR tracing (green, bottom).