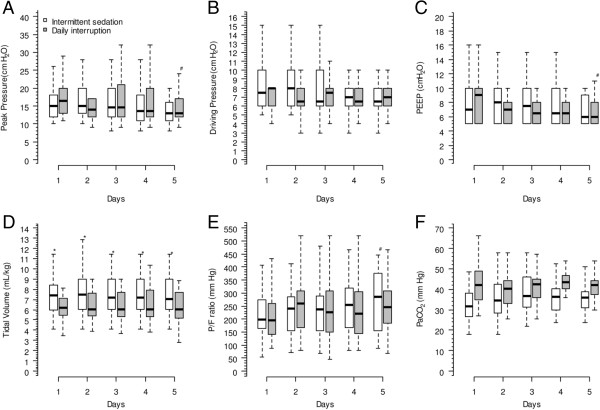
Figure 5.
Respiratory variables of both groups up to the fifth day after mechanical ventilation initiation. Panel (A) shows the peak pressure of all patients (P = 0.002 for time interaction and P = 0.549 for group interaction); panel (B) shows the driving pressure of all patients (P = 0.456 for time interaction and P = 0.549 for group interaction); panel (C) shows the median dosage of propofol of all patients (P = 0.001 for time interaction and P = 0.929 for group interaction); panel (D) shows the driving pressure of all patients (P = 0.549 for time interaction and P = 0.001 for group interaction); panel (E) shows the PaO2/FiO2 (P/F) ratio of the patients (P = 0.002 for time interaction and P = 0.793 for group interaction); and panel (F) shows the PaCO2 of all patients (P = 0.151 for time interaction and P = 0.334 for group interaction). *P < 0.05 versus intermittent sedation group, Mann-Whitney post hoc test. #P < 0.05 versus first day of the same group, Mann-Whitney post hoc test.

