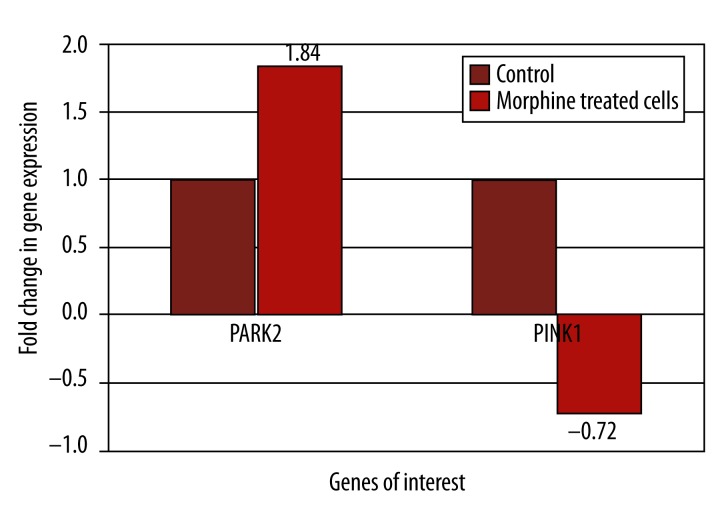
Figure 1.
Microarray analysis of gene expression with 2 hour morphine treatment. Microarray analysis was conducted on HTB-11 cells which had been treated with a 10−7 M morphine. The gene expression levels of the control (untreated) cells were set at 1 for both genes to normalize the data. The expression of the genes PARK2 and PINK1 were specifically analyzed through the software program GeneSpring to calculate the fold changes.

