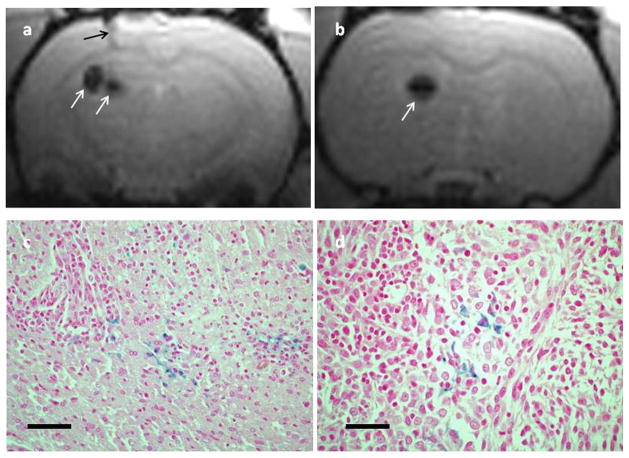
Fig. 3.
-weighted axial MR images (a, b) showing signal voids (white arrows) in normal rat brain following intracranial injection of iron oxide-loaded macrophages. The black arrow in (a) denotes the injection track. The locations of the voids correspond to the point of Ma injection as determined from the coordinates on the stereotactic frame. Images were acquired 3 days postinjection. The images were acquired at two different levels (4 mm separation) in the same animal. Representative histological sections (c, d) from the same animal acquired 7 days post iron oxide-loaded macrophage administration. Sections were stained with both H&E and Perls. There is clear evidence of iron oxide (blue stain) thus confirming the MRI findings. The scale bars in (c) and (d) correspond to 80 and 40 μm, respectively.

