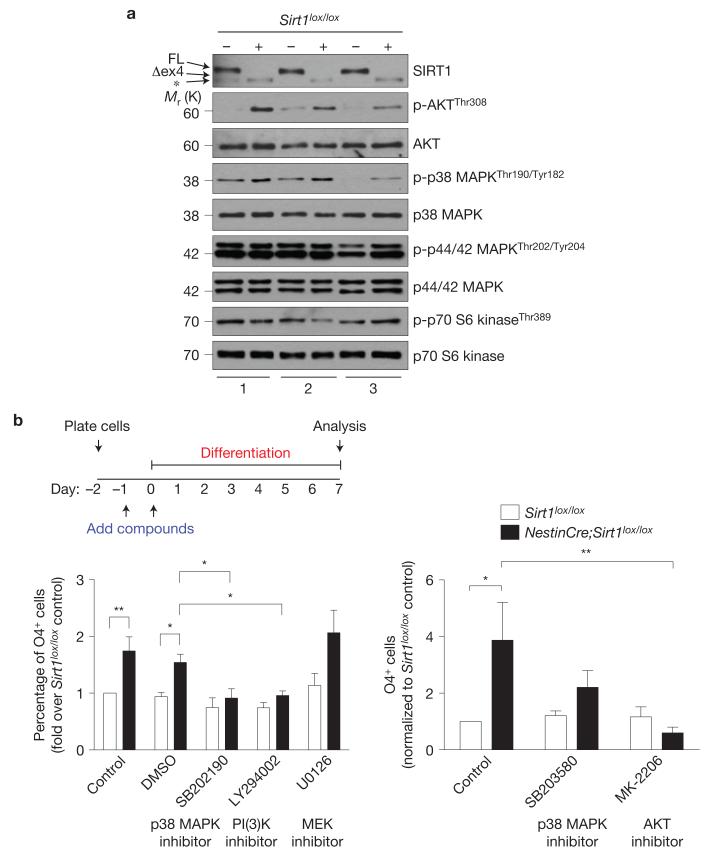
Figure 8.
Inhibition of p38 MAPK and AKT signalling reduces the production of oligodendrocytes from NSCs and neural progenitors lacking active SIRT1. (a) Increased AKT and p38 MAPK phosphorylation in NSCs and neural progenitors lacking active SIRT1. Immunoblots of lysates from 3 independent cultures of NSC and neural progenitors isolated from Sirt1lox / lox and NestinCre;Sirt1lox / lox adult mice. Antibodies specific against phosphorylated forms of AKT, p38 MAPK, p44/42 MAPK and p70 S6 kinase were used. Antibodies specific against total proteins were used as loading controls. FL, full-length SIRT1; Δex4, truncated inactive SIRT1 protein generated from the Sirt1 gene that lacks exon 4. *, protein that is distinct from the truncated SIRT1 protein and probably represents a splice variant of SIRT1 (see Supplementary Fig. S2d). (b) Activity of signalling kinases p38 MAPK and AKT is important for oligodendrocyte generation from NSCs and neural progenitors. Proliferating Sirt1lox / lox and NestinCre;Sirt1lox/lox NSCs and neural progenitors were incubated with p38 MAPK inhibitor SB202190 (10 μM) or SB203580 (1 μM), PI(3)K inhibitor LY294002 (10 μM), AKT inhibitor MK-2206 (1 μm), MEK inhibitor U0126 (10 μm) or dimethylsulphoxide (DMSO) vehicle for 24 h. Cells were then switched to differentiation medium (1% FBS) containing the same concentration of compounds or vehicle and grown for a further 48 h. Cells were allowed to differentiate without added compounds for 5 more days, with complete medium changes every other day. Cells were stained for the oligodendrocyte marker O4. Left panel: mean±s.e.m. of the following number of independent experiments, n = 9 for control and dimethylsulphoxide; n = 5 for SB202190; n = 6 for LY294002; and n = 4 for U0126. Two-way ANOVA, compound, P < 0.0001; genotype, P < 0.0001; interaction, P = 0.0165; Bonferroni post-tests, *P < 005, **P < 0.01. Right panel: mean ± s.e.m. of 4 independent experiments. Two-way ANOVA, compound, P = 0.0684; genotype, P = 0.0438, interaction, P = 0.0416; Bonferroni post-tests, *P < 0.05, **P < 0.01. = Uncropped images of blots are shown in Supplementary Fig. S8.

