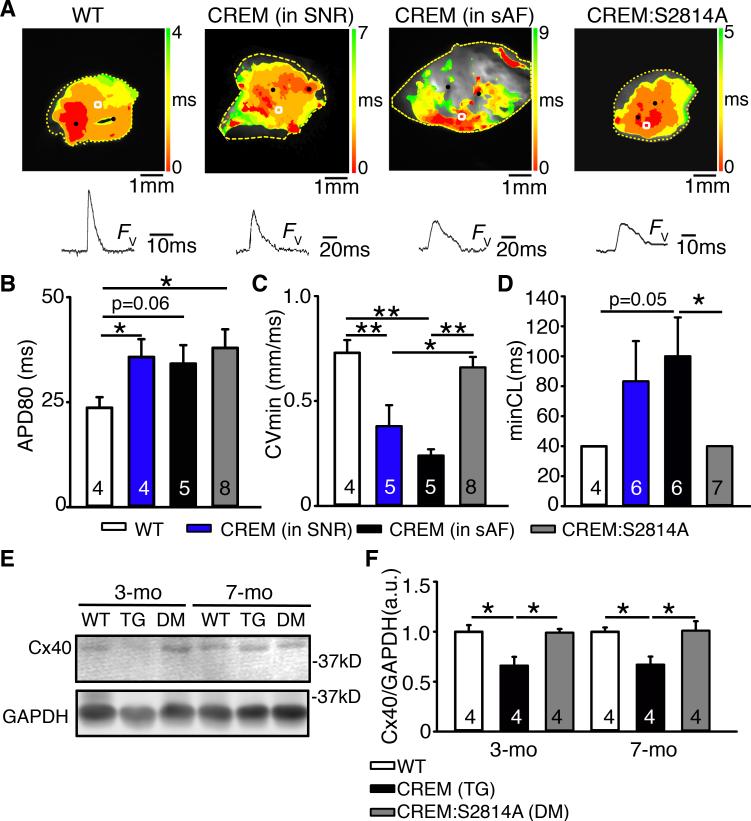
Figure 6.
Improved conduction velocity and excitability in CREM:S2814A mice. (A) Top: Activation map of isolated atria preparations obtained from 5-month-old mice. Bottom: Voltage fluorescence (Fv) traces obtained from the indicated regions (white squares). (B) APD80, (C) minimum conduction velocity, and (D) minimum cycle length that can pace the atria. (E) Western blots showing reduction in the level of Cx40 protein in CREM-mice before and after the onset of sAF. (F) Quantification of Cx40 protein level normalized to GAPDH. Numbers in the bars indicate the number of animals studied. *P<0.05, **P<0.01.

