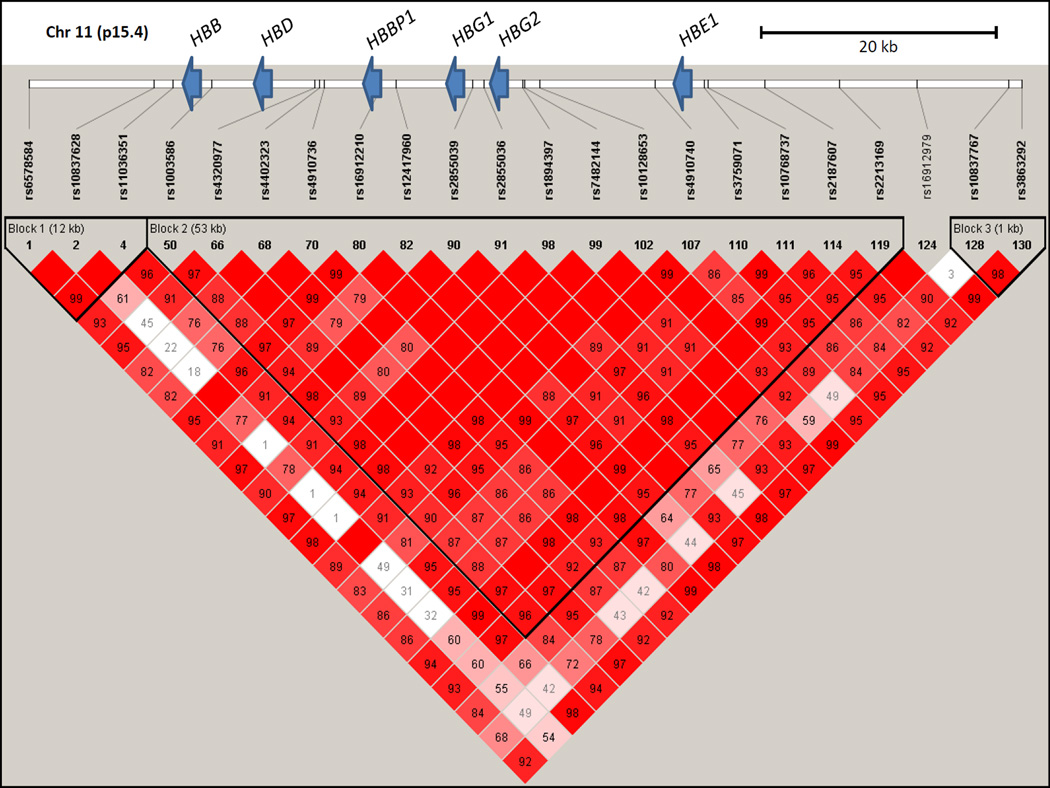
Figure 1.
Linkage disequilibrium across the β-globin locus in SIT Trial participants with sickle cell anaemia. Haploview Version 4.2 visualization of LD (D′) is shown for 22 SNPs with minor allele frequencies >5% genotyped on the HumanOmni1-Quad BeadChip. The calculated D′ for pairwise comparisons between SNPs is displayed in each box as the decimal value between 0 and 99, and blank boxes represent complete LD (D′ = 1). The relative positions of the β-globin cluster genes compared to the SNPs genotyped along chromosome 11p15.4 are indicated by blue arrows.

