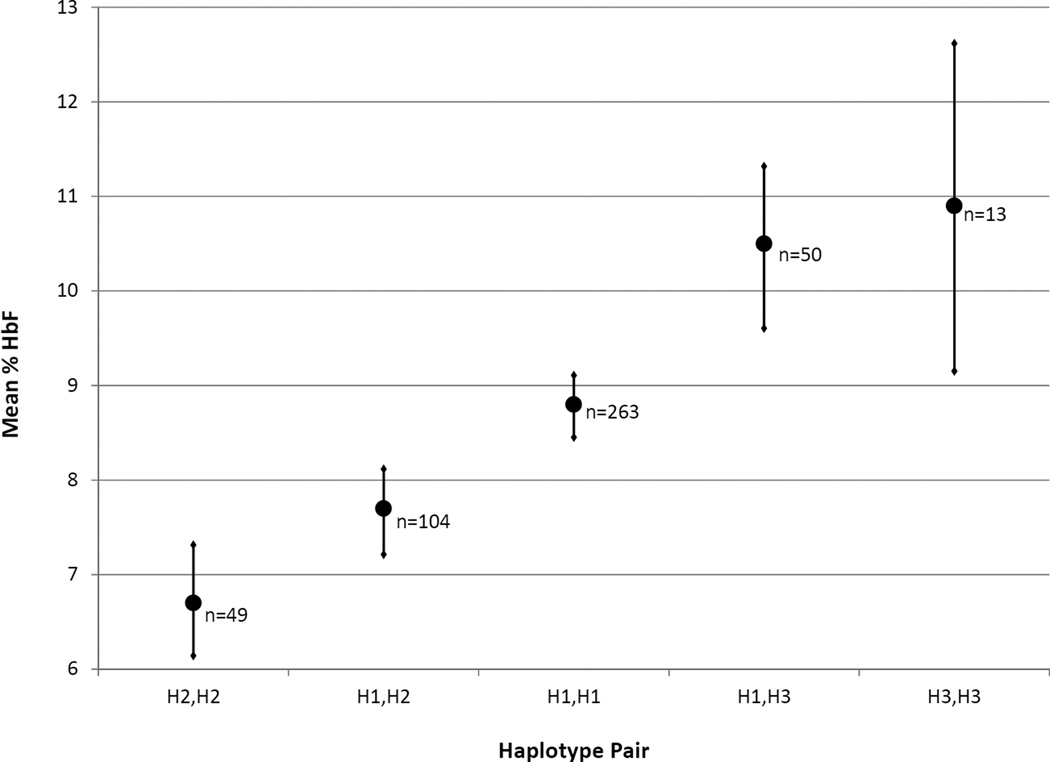
Figure 2.
Fetal haemoglobin (HbF) levels by haplotype group in SIT Trial participants (n=479). Mean HbF (filled circle) and standard error (horizontal bar) is shown with number of individuals (n) in each haplotype pair group indicated. For statistical analyses, H2,H2 and H1,H2 were grouped together, and H3,H3 and H1,H3 were grouped together. Kruskal-Wallis non-parametric testing demonstrated a significant difference in the sample means (p=0.006). To test the association with haplotype, HbF was log transformed and multiple linear regression models were adjusted for age and gender. Carrying one or two copies of H2 was associated with a decreased HbF (7.4%) compared to the 8.8% level in the H1,H1 reference group (95% confidence interval [CI]: 0.72–0.98; p=0.01). Conversely, carrying one or two copies of H3 was associated with increased HbF (10.5%) compared to the H1,H1 reference group (95% CI: 1.02–1.39; p=0.05).

