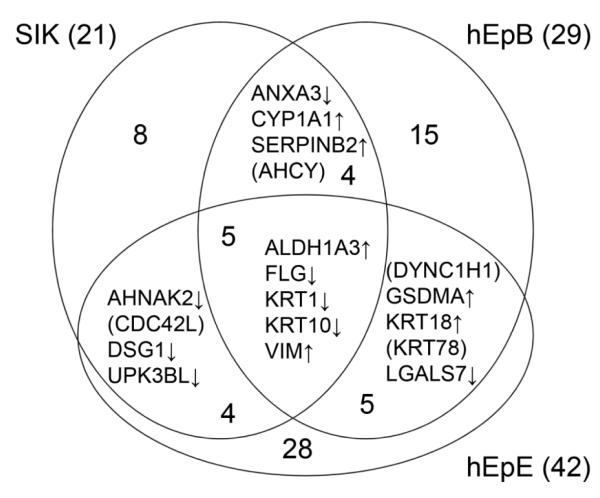
Figure 3.
Common changes in protein level in pairwise comparisons of cultures treated with TCDD versus no treatment. An upward arrow indicates an increase in amount under TCDD treatment compared to no treatment, and a downward arrow shows a decrease under TCDD treatment compared to no treatment. Proteins in parentheses increased in one cell strain and decreased in another.

