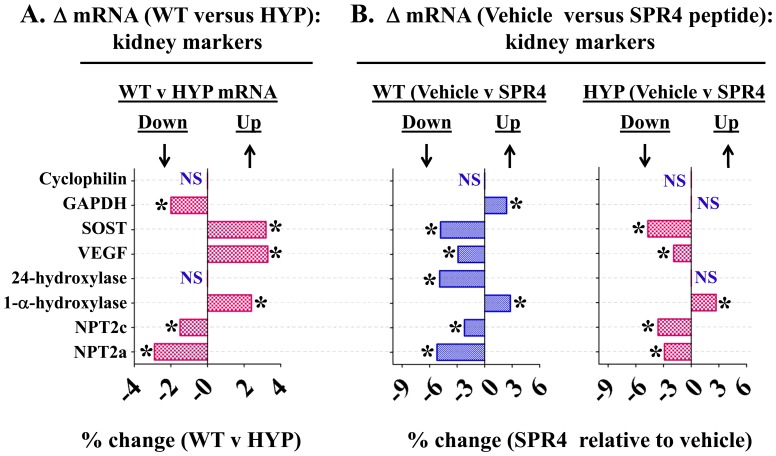
Figure 3. Whole kidney gene expression (mRNA) comparisons as measured by quantitative RT/PCR (qRT-PCR) for wild type (WT) and HYP mice infused with vehicle or SPR4 peptide for 28 days.
Column headings represent; WT = wild type mice, HYP = X-linked hypophosphatemic rickets mice, SPR4 = infused SPR4-peptide and Vehicle = Saline infused. For gene analysis mRNA was prepared from whole kidneys snap frozen in LN2 and homogenized. For qRT-PCR gene analysis fold differences in expression calculated by the Pfaffl method [163] were statistically analyzed for significance using the One Sample t-test and the Wilcoxon Signed rank-test with theoretical means set to 1. Results are significant (* = p<0.05) unless indicated by NS (see also Table 3 for detailed statistics). ND = Not done, NS = Not SignificantIndex: Cyclophilin = cyclophilin; GAPDH = Glyceraldehyde 3-phosphate dehydrogenase; SOST = Sclerostin; VEGF = Vascular Endothelial Growth factor; 24-Hydroxylase = 1,25-hydroxyvitamin D3 24-hydroxylase (CYP24A1); 1-α-Hydroxylase = 25-hydroxyvitamin D3 1-alpha-hydroxylase (CYP27B1); NPT2c = Sodium-dependent phosphate co-transporter (Slc34a3); NPT2a = Sodium-dependent phosphate co-transporter (Slc34a1); NS = not significant; * = P<0.05. Histogram bars to the left of zero on the axis indicate down regulation and to the right up regulation.

