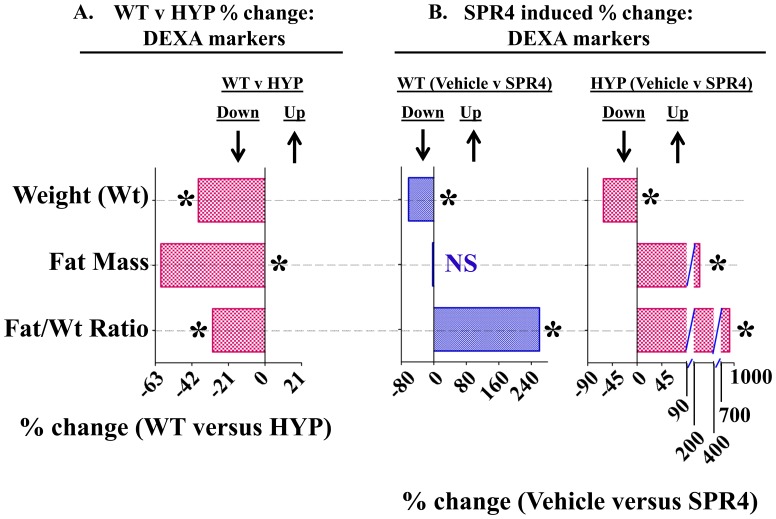
Figure 7. Temporal changes in (Weight, fat mass and fat mass/weight ratio) as measured by Dual Energy X-ray Absorptiometry (DEXA) for wild type and HYP mice infused with vehicle or SPR4-peptide for 28 days (See Figure 6 for static changes).
The mean percentage change over the 28 days for each metric was calculated and the percentage differences between the groups plotted as a histogram (see also Table 5 ). Values are mean percentage differences and are significant (* = P<0.05) unless indicated by NS (unpaired t test confidence interval = 95%). Column headings represent; WT = wild type mice, HYP = X-linked hypophosphatemic rickets mice, SPR4 = infused SPR4-peptide and Vehicle = Saline infused. Histogram bars to the left of zero on the y-axis indicate down regulation and to the right up regulation. DEXA measurements using a Lunar PIXImus system were carried out as described previously and discussed in methods [140]. Index : Weight (Wt) = percentage difference in weight change over 4 weeks; Fat-Mass = percentage difference in total fat-mass change over 4 weeks; Fat/Wt Ratio = percentage difference in total fat-mass/weight change over 4 weeks.

