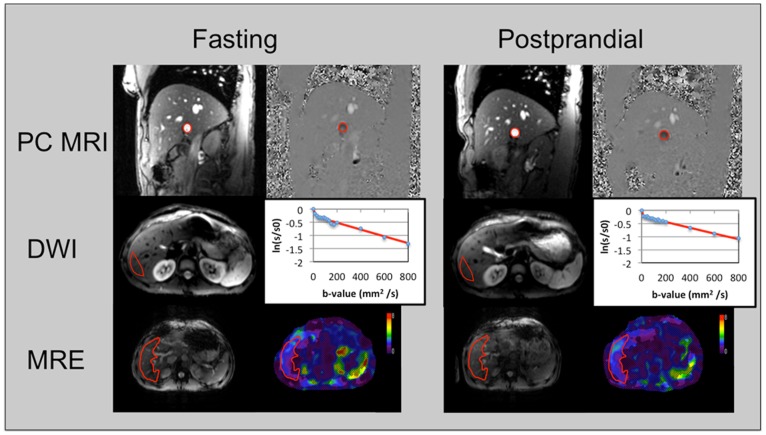
Figure 2. Image processing demonstrated in a 30 year-old healthy volunteer.
Top row demonstrates the region of interest placement in the portal vein (PV) on the phase contrast magnitude and phase images obtained in fasting and postprandial conditions. PV flow and velocity values were 21.15 ml/s/2.7 cm/s (fasting) and 31.1 ml/s/17.8 cm/s (postprandial). Middle row demonstrates the region of interest placement in the right hepatic lobe on the diffusion images (for b = 15) and plots for bi-exponential fitting in fasting (true diffusion coefficient D, pseudodiffusion coefficient D* and perfusion fraction PF of 1.3×10⁻³ mm2/s, 57×10−3 mm2/s and 22%) and postprandial conditions (1.1×10⁻³ mm2/s, 171×10−3 mm2/s, 19%). Bottom row shows the gradient echo MRE reference image (left) and liver stiffness (LS) maps in fasting and postprandial conditions (LS was 1.9 and 1.9 kPa in fasting and postprandial conditions, respectively).

