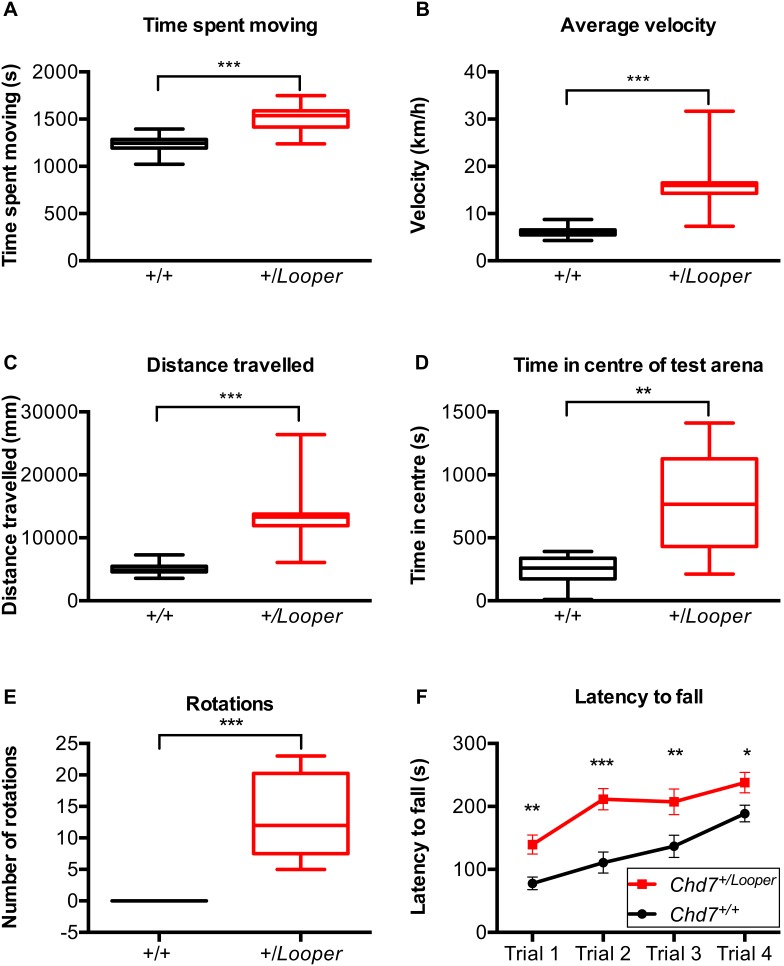
Figure 5. Looper mice are hyperactive.
A–E) Box and whisker plots illustrating the mean and 1–99 percentile range for cohorts of Chd7+/ Looper and Chd7+/+ littermates for measures taken during Locomotor Cell and Swim testing. **p<0.001, ***p<0.0001 calculated using the Mann Whitney test. A) Time spent moving. B) Average velocity. C) Distance travelled. D) Time spent in the centre of the test arena. E) Complete rotations made during 1 min of swimming. F) Plot of the average latency to fall off the rotor rod over the course of each of four trials, for cohorts of Chd7+/ Looper and Chd7+/+ littermates. Error Bars = SEM. *p<0.05, **p<0.001, ***p<0.0001 calculated using two-way ANOVA and post-hoc Fisher’s Least Significant Difference test (F). n = 12 Chd7+/+ and 12 Chd7+/ Looper mice.

