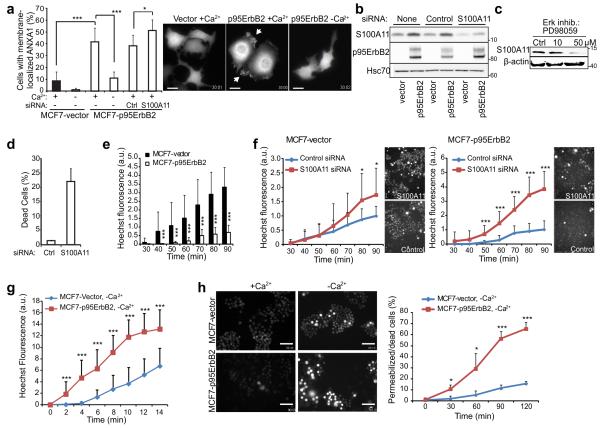
Figure 1. S100A11 protects MCF7 cells against p95ErbB2 expression-induced membrane damage.
(a) Quantification (left) and representative images (right; scale bars, 20 μm) of ANXA1-GFP-expressing MCF7-vector and -p95ErbB2 cells with membrane associated ANXA1-GFP after 2 h incubation in medium with or without Ca2+. When indicated, cells were transfected with control or S100A11-I siRNA 72 h prior to the experiment. See Supplementary Movie 1 for the dynamic distribution of ANXA1-GFP in MCF7-p95ErbB2 cells.
(b) Representative immunoblot of S100A11 (13 kDa), p95ErbB2 (95 kDa) and Hsc70 (70 kDa; loading control) in lysates of MCF7-vector and –p95ErbB2 cells left untreated or transfected with indicated siRNAs for 72 h. Markers listed represent protein molecular weights in KDa.
(c) Immunoblot of S100A11 level in MCF7-p95ErbB2 cells treated for 72 h with Erk inhibitor PD98059. β-actin served as loading control.
(d) Cell death assay in MCF7-p95ErbB2 cells 96 h after transfection with control or S100A11-I siRNA as analyzed by Propidium iodide (PI) exclusion assay and measured by using a fluorescence Celigo imaging cytometer.
(e) Permeability of MCF7-vector and -p95ErbB2 cells to Hoechst-3342 under normal growth conditions (30-90 min). Representative images of cells are shown in figure 1H (+Ca2+ panel).
(f) Hoechst-3342 leakage into MCF7-vector and -p95ErbB2 cells treated with indicated siRNAs for 48 h. Fluorescence intensity in each replicate was normalized to that in control siRNA-treated cells 90 min after dye addition. Accompanying images were taken at 90 min.
(g) Influx of Hoechst-3342 into MCF7-p95ErbB2 and MCF7-vector cells incubated in Ca2+ free medium as measured every 2 minutes starting from the time the dye was added to the cells.
(h) Representative images of MCF7-vector and -p95ErbB2 cells incubated with Hoechst-3342 in imaging medium +/− Ca2+ for 120 min (left; scale bars, 100 μm) and quantification of permeabilized/dead cells at indicated time points (right).
Error bars, SD for a minimum of 20 randomly chosen cells / sample in a representative (n ≥ 3) experiment (A, and F-H) or for three independent experiments in triplicate (D). Dead cells with high intensity staining were excluded from analysis in figures F-H. All data are representative of a minimum of three independent experiments. The asterisks represent P Values based on Students t-test: P Value: * P < 0.05, *** P < 0.001.

