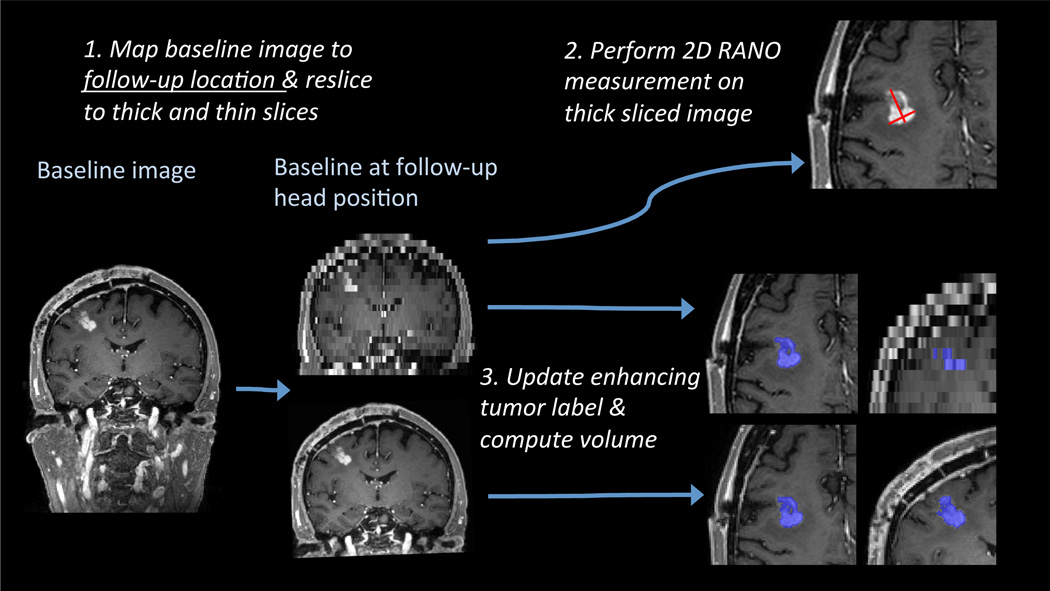
Fig. 2.
Methods flow chart: First the baseline MEMPRAGE gets mapped to a follow-up location and resliced to 5mm and 1mm slices. The 2D RANO measure is performed manually only on the 5mm sliced intensity image, the 3D volume analysis (automatic label update and volume computation) is performed on both the 5mm and 1mm sliced images.

