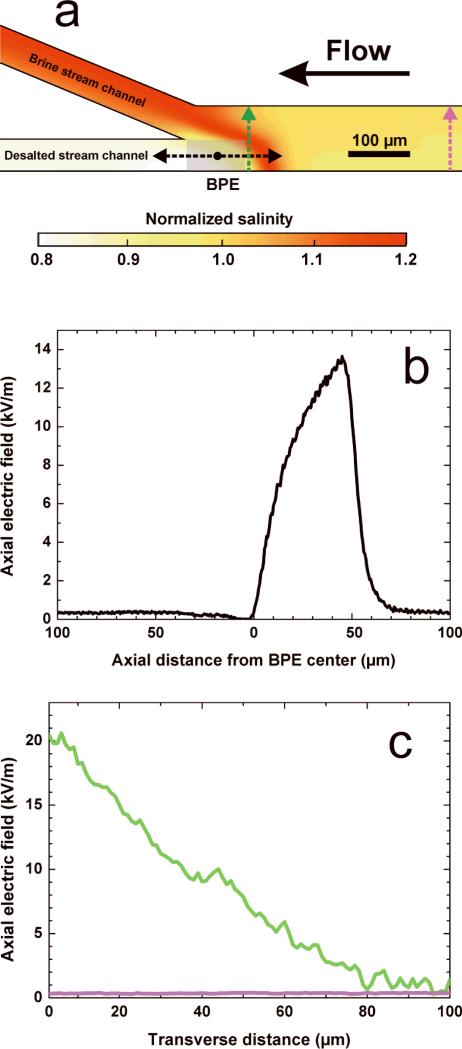
Figure 2.
(a) Local salinity distribution simulated for a 50 mS/cm NaCl solution with Etot = 3.0 V and a total PDF rate of 0.08 μL/min from inlet to outlets; the current through the BPE is 50 nA. (b) Simulated profile of the axial electric field strength along the centerline of the desalted stream (as indicated by the black arrows in panel a). (c) Simulated profiles of the axial electric field strength along the transverse direction of the desalination channel (as indicated by the green and purple arrows in the corresponding color in panel a).

