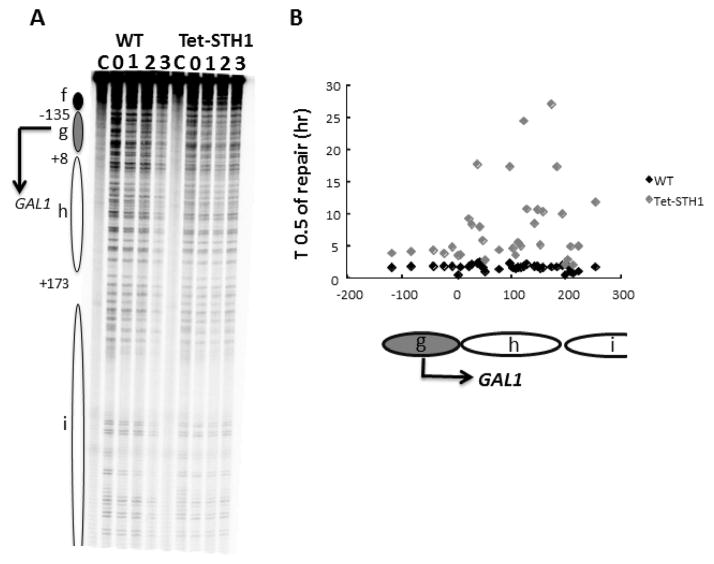
Figure 4. A, B,C. Loss of STH1 dramatically inhibits repair of NMPs in the GAL1 locus.
Repair of NMPs in WT and Tet-STH1 strains was analysed at the nucleotide resolution as described in materials and methods. A. Panel shows representative sequencing gel of DNA damage and repair profile in yeast cells. Each band represents a single NMP site in a given DNA fragment, band intensity corresponds to number of DNA fragments containing NMP site in the same location. Decreasing intensity of band over the repair time course indicates successful repair of NMPs. C: untreated control, the ovals represent nucleosome locations in glucose cultures, where the intensity of shading refers to variability of the nucleosome positions (darkest, least variable; lightest, most variable). The arrow on the left represents transcription start site (TSS). Nucleotide positions are allocated in relation to the start of GAL1 gene. B. Graph of the time required to repair 50% of the NMPs (T1/2) at individual sites in the GAL1 region in glucose in WT and Tet-STH1 mutant.

