
FIGURE 2.
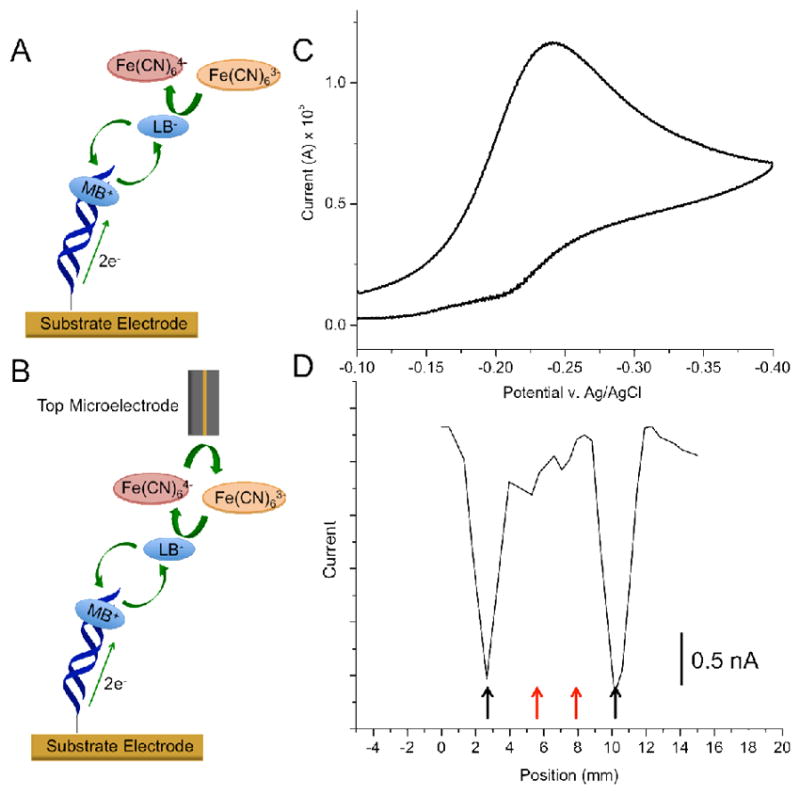
Comparison between bulk versus spatially resolved electrochemical readout. (A) Conventional detection involves measuring electrocatalytic currents at the substrate electrode: (i) intercalated methylene blue (MB) is reduced to leucomethylene blue (LB) through well-matched DNA duplexes; (ii) LB dissociates from the duplex and reduces ferri- to ferrocyanide, and (iii) the resulting MB intercalates back into the DNA duplex to restart the cycle. (B) Two-electrode electrocatalysis. The same chemistry occurs at the substrate electrode, but a probe microelectrode reduces electrochemically-produced ferrocyanide back to ferricyanide, providing amperometric readout via a secondary electrode. (C) Electrocatalytic signal recorded at a substrate pad modified with two strips of well matched and two strips of mismatched DNA (see supporting information for sequences). The bulk electrochemical signal from the substrate pad shows a classic electrocatalytic peak, indicating the presence of some well-matched DNA on the electrode surface. (D) Electrochemical response of the probe electrode as a function of its position over the same substrate surface in (C) using the two-electrode detection method. Here, the existence of two different sequences of DNA: matched (black arrows) and mismatched (red arrows) becomes apparent. The surface was scanned at ~0.6 mm/sec with a 100 μm gold microelectrode. (Analyte solutions contained 2 μM MB and 200 μM ferricyanide in 10 mM Tris buffer with 100 mM KCl, 2.5 mM MgCl2, and 1 mM CaCl2, pH 7.6.)