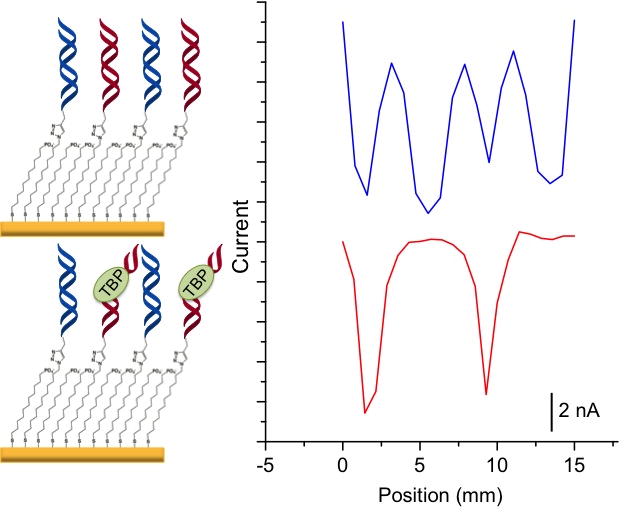
Figure 3.

TBP detection on a patterned surface. Current increases negatively down the y-axis. The surface was patterned with four alternating strips of DNA that either lack or contain a TBP binding site. The blue trace is a scan in 2 μM methylene blue and 200 μM ferricyanide before the addition of TBP but after a 30 minute incubation in 100 μM BSA, which controls for non-specific protein binding. The red trace is after a 15-minute incubation with 15 nM TBP protein; the current corresponding to the TBP-binding sequences was diminished, while the current at locations without the protein binding site were unaffected.
