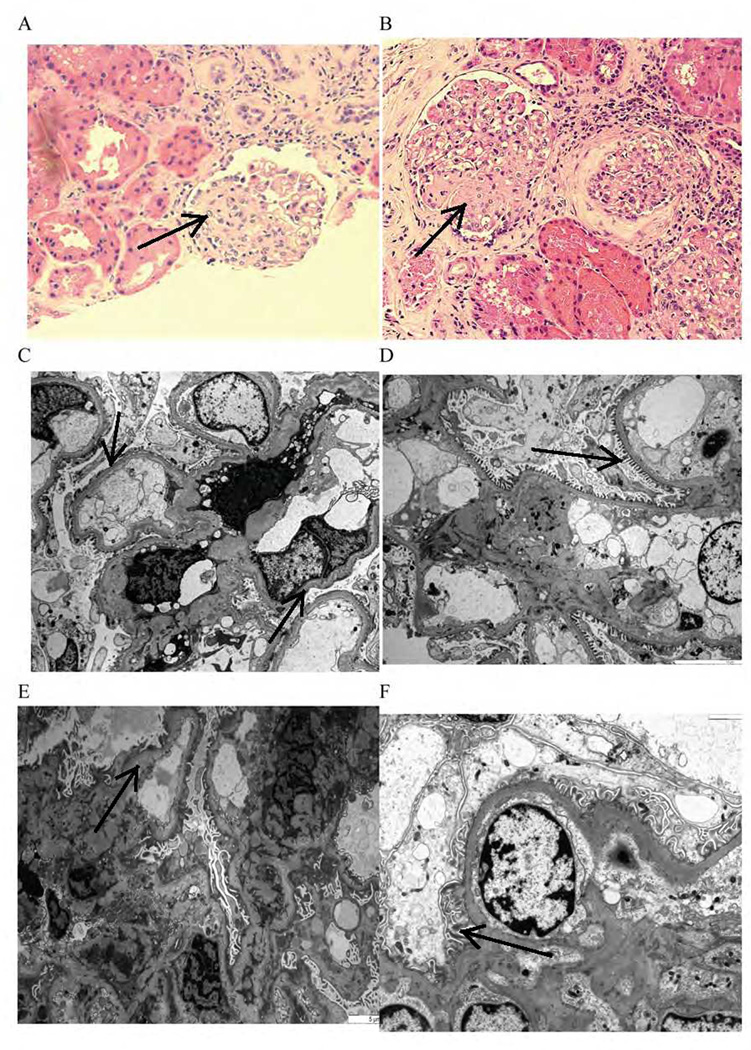
Figure 2. Histopathologic changes before and after therapy.
Biopsy taken 10 months after kidney transplantation from a patient with recurrent FSGS shows segmental glomerular sclerosis changes on light microscopy (arrow) before treatment (A) that did not change (arrow) after therapy (B). Electron microscopy (power of 3000) showed moderate (arrow) podocyte foot process effacement (C) that recovered (arrow) after therapy (D). Biopsy taken from another patient 3 months after transplantation; electron microscopy (scale of 5 µm) shows severe (arrow) podocyte foot process effacement (E) that recovered (arrow) after therapy (F); no light microscopic changes

