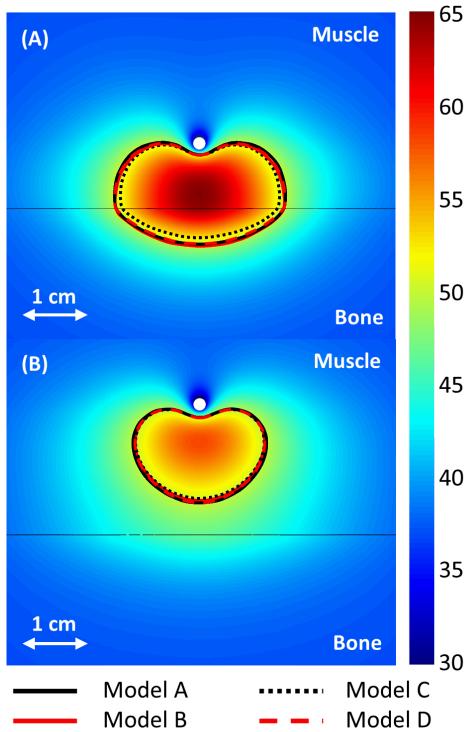
Figure 4.
240 CEM43°C contours calculated with Models A-D after a 10 minute ablation are shown in the central plane between the two transducers. The applicators (white circle) are placed 1 and 2 cm from a flat bone (black line) in A and B, respectively. A color map shows the temperatures (°C) calculated with the constant transmission volumetric model (Model B).

