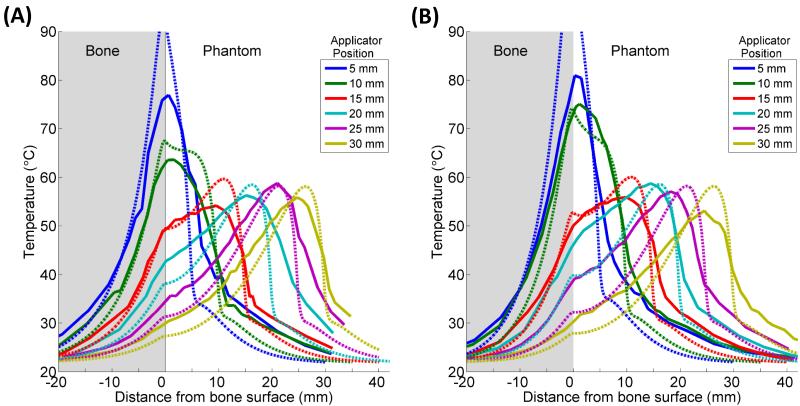
Figure 7.
Experimental (—) and simulated (- - -) temperature profiles after 10 minute ablations in two phantoms containing cortical (A) or cancellous (B) bone. Temperature along a line perpendicular to the bone surface and adjacent to the center of one transducer, as in Figure 3B, is plotted as a function of distance from the bone surface, which is at x = 0. Positive x-values are in the phantom, and negative values are inside the bone. Each solid curve corresponds to a single experimental trial with the applicator placed at the designated distance from the bone. The experiments were simulated with Model B, and the theoretical results are superimposed as dashed lines.

