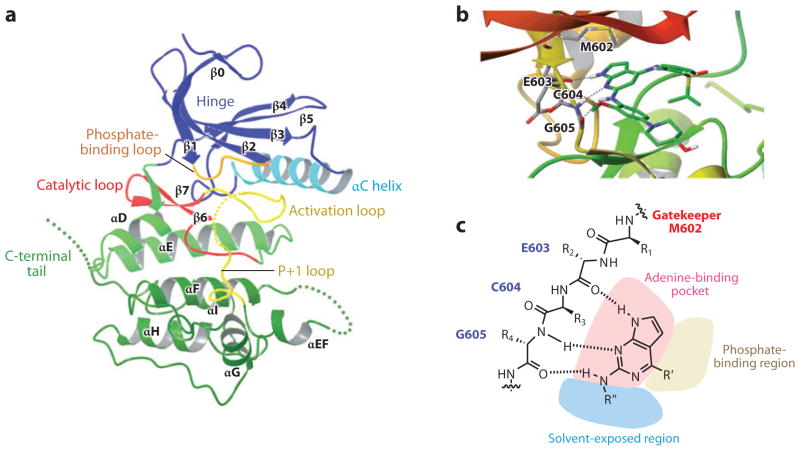
Figure 2.
(a) Ribbon representation of the structure of the Mps1 catalytic domain. Key structural elements are labeled. The structure has been rendered from the Protein Data Bank (PDB) entry 3DBQ, using the Maestro interface from Schrödinger. The dotted lines represent the disordered regions in the activation loop, the loop between αEF and αF and also at the C-terminal tail. (b) Ribbon representation of the structure of Mps1 in complex with a small-molecule inhibitor, Mps1-IN-1. The structure has been rendered from the PDB entry 3GFW using the Maestro interface. The residues in the hinge region are shown. (c) Illustration of the inhibitor-binding mode. The gatekeeper residue M602, hinge region residues that interact with the inhibitor and the ATP-binding pocket are shown. The dotted lines represent hydrogen bonds.

