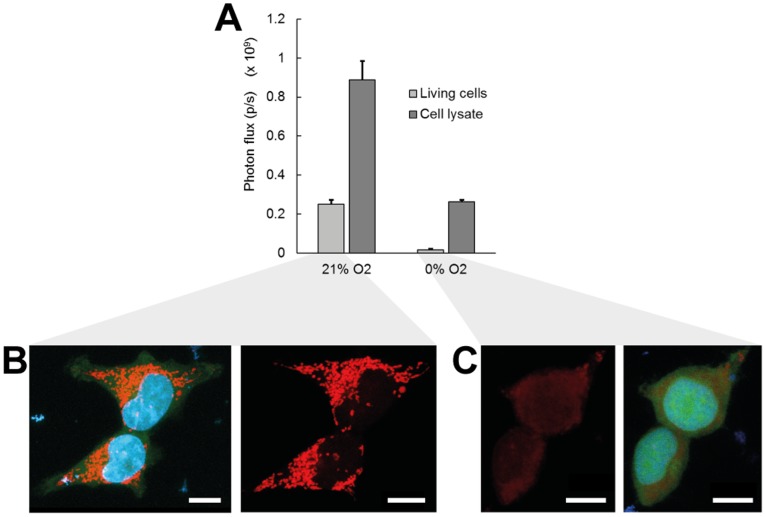
Figure 1. The activity of firefly luciferase in free solution or in intact 293T cells is dependent on available oxygen concentration.
(A) Total photon flux at normoxic (21% O2) and hypoxic (0% O2, via addition of 1% Na2SO3) conditions emitted from a luciferase-dependent bioluminescence reaction in intact cells or from an equal concentration in cell lysates. Error bars, ±1 s.d. unit; n ≥5. (B, C) Confocal fluorescence imaging of cell mitochondria in cells exposed to (B) normoxic or (C) hypoxic oxygen concentrations. Images are maximum intensity projections of cell mitochondria stained with MitoTracker Red (red), cell nucleus stained with Hoechst (blue), and GFP signal (green) from stably transduced 293T cells. Left and right panels show the stained mitochondria with or without the other two channels, to reveal background fluorescence. Scale bar, 10 µm.

