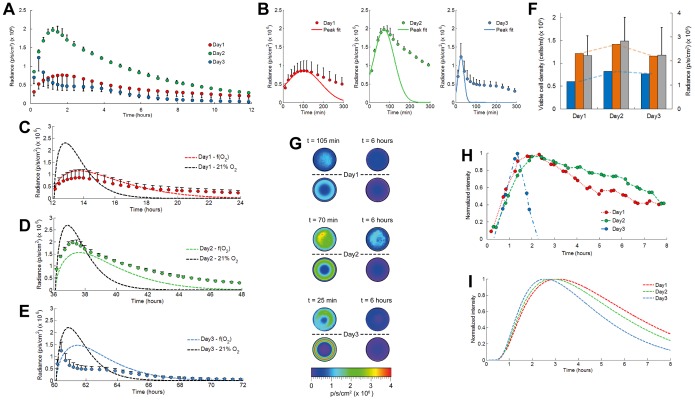
Figure 4. Validation of the bioluminescence-oxygen model for quantitative interpretation and analysis of bioluminescent light emitted from cell-seeded hydrogels.
(A) Average photon flux measured for luciferase reporter 293T cells embedded in agarose gels that are axially confined by circular glass plates. Dynamic time point measurements were performed during 12 hour periods. (initial luciferin concentration, 47 µM) Error bars, ±1 s.d. unit; n ≥3 (B) Emission peak intensities were fitted by Gaussian functions. Time-lapse measurements of the average emitted photon flux were compared with simulation results from the bioluminescence-oxygen model in presence or absence of oxygen gradients at day 1 (C), day 2 (D), and day 3 (E). (F) Comparison of simulated peak emission intensities in presence (blue) or absence (orange) of oxygen gradients, with average viable cell densities obtained from quantitative DNA analyses (gray). Error bars, ±1 s.d. unit; n = 6. (G) 2D bioluminescence profiles of cell-seeded agarose gels imaged from top position (hydrogel diameter, 8 mm). Profiles above the dashed lines are measured with the IVIS 100, and profiles below are simulated from the bioluminescence-oxygen model. The left column shows activity at the peak position and the right column shows activity after 6 h (steady-state condition) (H) Bioluminescence microscopy of 293T cells embedded in agarose at the central hydrogel position and (I) comparison with the simulated activity in the hydrogel center.

