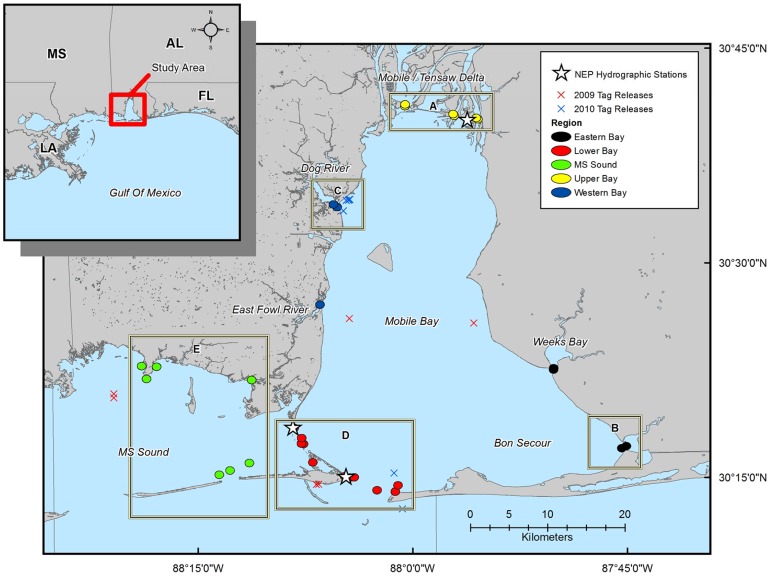
Figure 1. Map of the Coastal Alabama Acoustic Monitoring Program (CAAMP).
The circles indicating receiver locations are scaled to the approximate mean detection range, and are coded by region: Upper Bay in yellow (A, n = 6), Eastern Bay in black (B, n = 4), Western Bay in blue (C, n = 5), Lower Bay in red (D, n = 11), and MS Sound in green (E, n = 7). The white stars indicate the location of the National Estuary Program (NEP) mooring stations from which hydrographic data were obtained. X's indicate release locations for the telemetered bull sharks in 2009 (red) and 2010 (blue) subsequently detected in the array.

