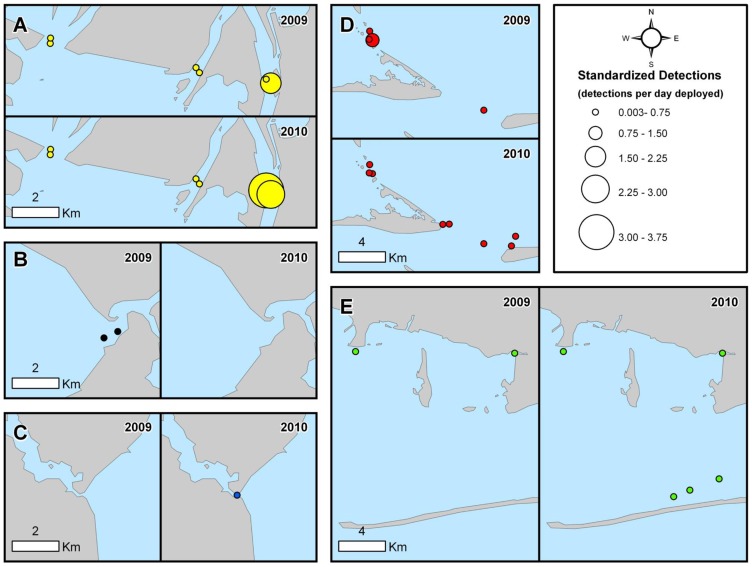
Figure 4. Distribution of bull shark detections.
Number of bull shark acoustic detections (detections per day deployed) throughout the CAAMP array in 2009 and 2010. Detections were standardized both to the receiver type (WHS 3050 vs WHS 2000, which had different detection intervals) and the number of days receivers were deployed. Colors (yellow, red, blue, black, and green) and letters (A–E) are consistent with Figure 1.

