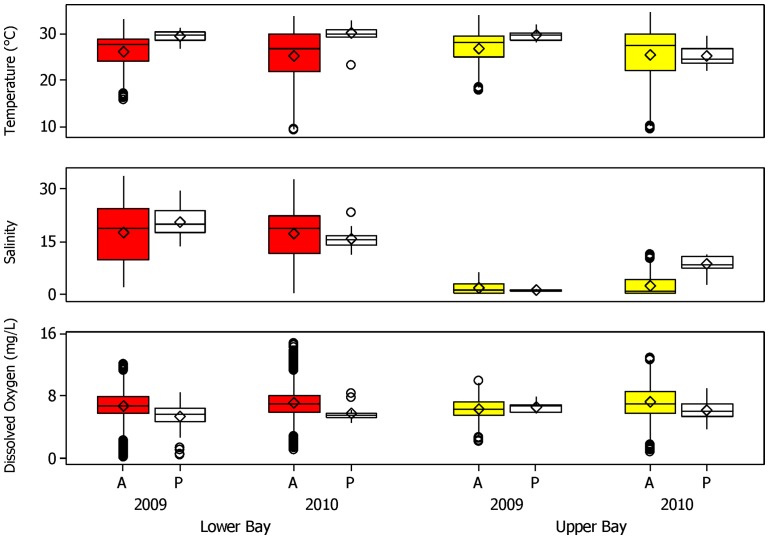
Figure 5. Bull shark presence as a function of hydrographic data.
Box and whisker plots (median, interquartile range) of temperature, salinity and dissolved oxygen are shown during periods of telemetered bull shark absence (A) and presence (P) in the lower (red) and upper (yellow) portions of Mobile Bay. Mean values are shown with diamonds, and circles indicate outliers.

