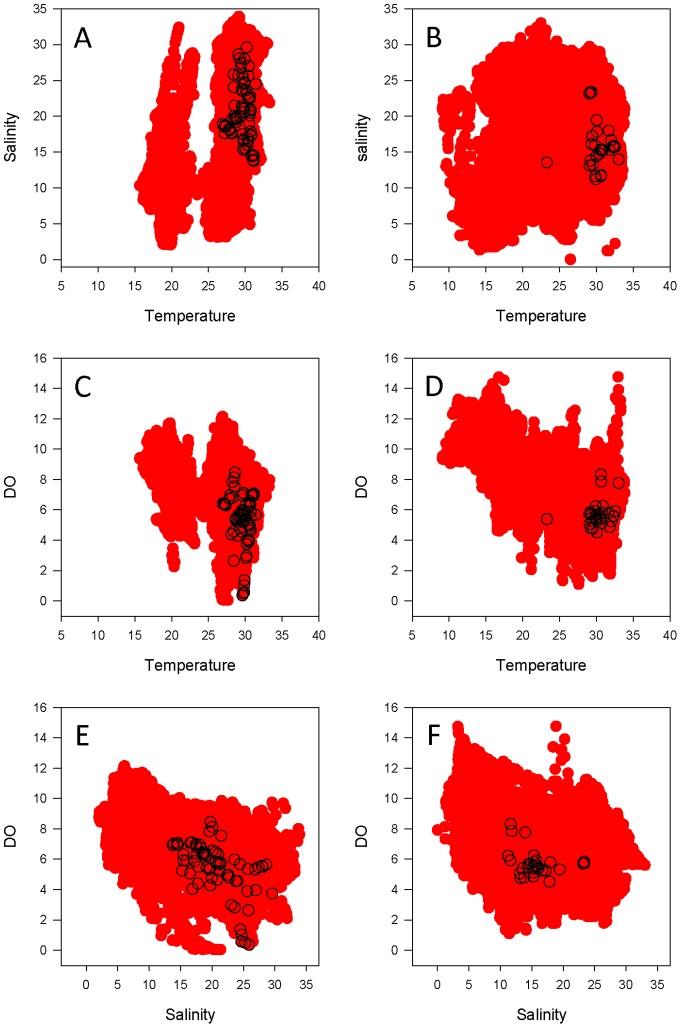
Figure 6. Bull shark dynamic habitat use in the lower bay.
Dynamic habitat use of the lower Mobile Bay by bull sharks acoustically detected in 2009 (left column) and 2010 (right column): Temperature vs. Salinity (A, B), Temperature vs. Dissolved Oxygen (C, D), and Salinity vs. Dissolved Oxygen (E, F) are shown. Areas in red indicate the available dynamic habitat (data from the NEP mooring stations), and open circles indicate the presence of telemetered bull sharks.

