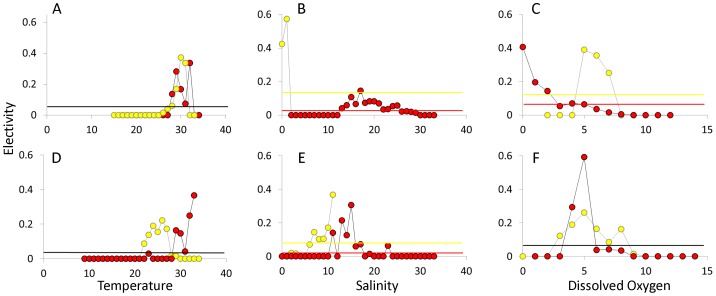
Figure 8. Bull shark electivity.
Electivity plots for the lower (red) and upper (yellow) portions of Mobile Bay in 2009 (A–C) and 2010 (D–F). Electivity data are plotted for temperature (A, D) salinity (B, E) and dissolved oxygen (C, F). Horizontal lines represent neutral selection in the upper (yellow) and lower (red) bay. Horizontal black lines are used when the neutral selection value is the same between the upper and lower bay.

