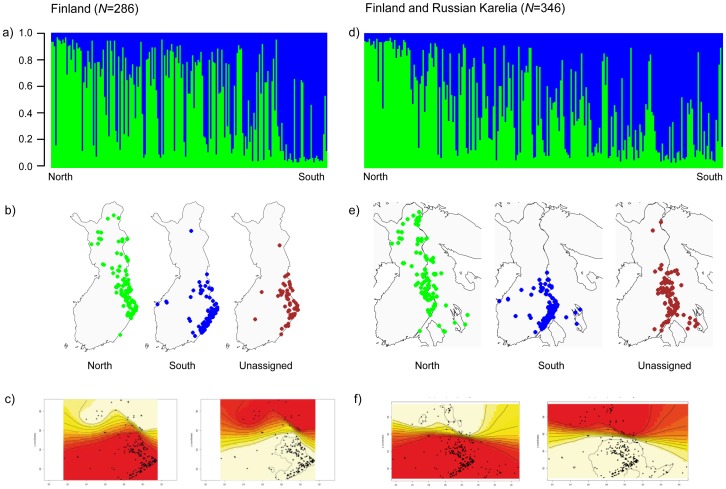
Figure 2. Bayesian clustering results of Finnish and Russian Karelian bears with Structure (Pritchard et al. 2000).
Bar plots show the assignment probabilities for each bear to one of the identified two clusters when only samples from Finland were analyzed (a) and samples from Finland and Russian Karelia pooled together (d); northern cluster (green), southern cluster (blue). The y-axis shows the calculated membership coefficient (q). Individuals are arranged by latitude from north (left) to south (right). (b and e) The maps show the genotypes in accordance to their assignment in Structure and geographical location. Individuals which were not assigned unambiguously (membership coefficient q<0.7) are shown on a separate map as dark red dots. (c and f) Maps on the bottom show the assignment with the program Geneland (Guillot et al. 2005).

