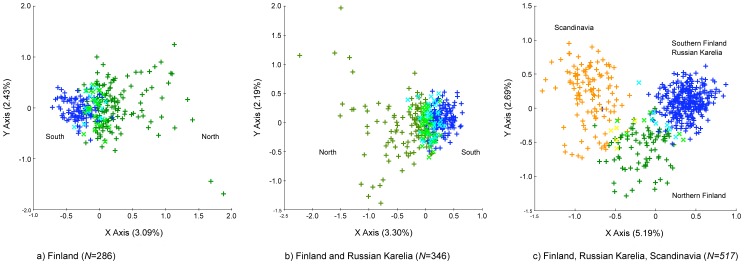
Figure 3. Factorial correspondence plots for brown bears sampled 2006–2010 in Finland, Russia, Norway and Sweden.
Different colors represent the clusters identified by the Bayesian clustering approach. (a) FCA analysis of the Finnish samples only: northern cluster (green), northern cluster with a membership coefficient (q) <0.7 (light green), southern cluster (blue), southern cluster with assignment membership probability <0.7 (cyan). (b) FCA analysis of Finnish and Russian Karelian samples: northern cluster (green), northern cluster with an assignment membership probability <0.7 (light green), southern cluster (blue), southern cluster with assignment membership probability <0.7 (cyan). (c) FCA analysis of Finnish, Russian Karelian populations and bears sampled in Northern Norway and Sweden: northern cluster (green), northern cluster with a membership coefficient <0.7 (light green), southern cluster (blue), southern cluster with assignment membership probability <0.7 (cyan), western (Scandinavian) cluster (orange), western cluster with an assignment membership probability <0.7 (yellow).

