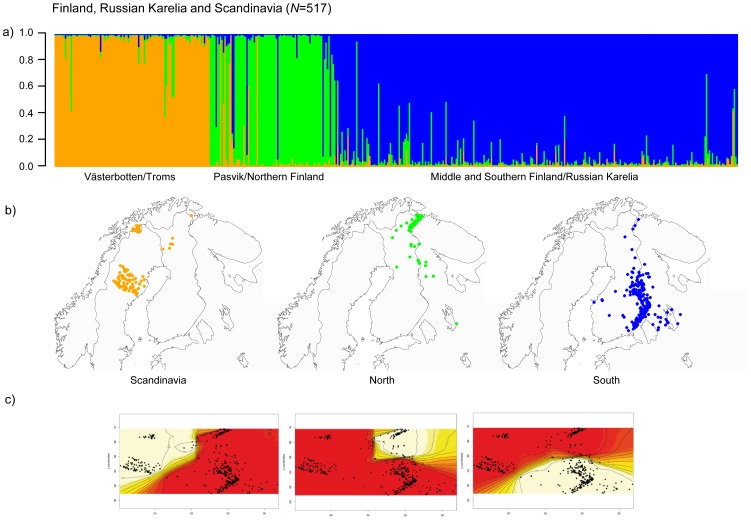
Figure 4. Assignment of bears sampled 2006–2010 in Northwestern Europe with the program Structure (Pritchard et al. 2000).
Bar plots show the assignment probabilities for each bear to one of the three identified clusters (a). Genotypes are sorted “clockwise” in accordance to their location from south-west in Sweden to south east in Finland and Russia according to from left to right: in orange Västerbotten (south-north) and Troms (west-east), in green Northern Finland (west-east) and Pasvik (north-south), in blue Southern Finland and Russian Karelia (north-south). The y-axis shows the calculated membership coefficient (q). (b) The maps show the genotypes in accordance to their assignment in Structure and geographical location: western cluster in Scandinavia, namely Västerbotten and Troms, shown in orange; northern cluster in green and southern cluster in blue. (c) Maps on the bottom show the assignment with the program Geneland (Guillot et al. 2005).

