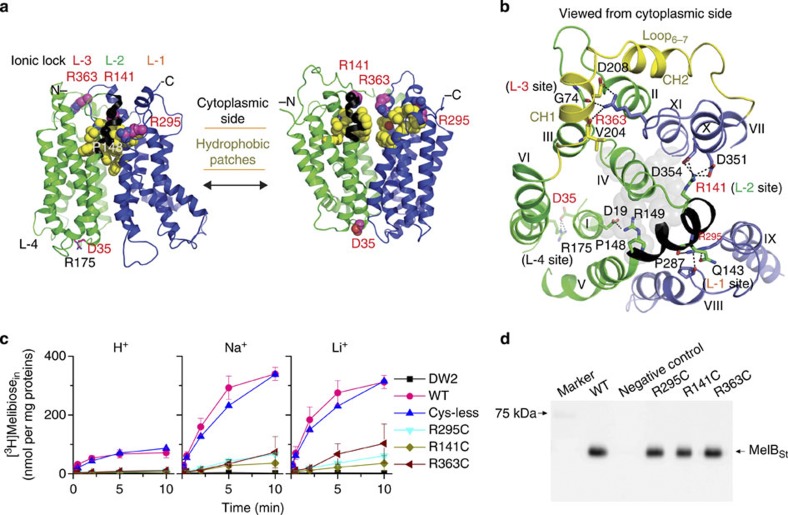
Figure 6. Ionic locks and conformational cycling.
N- and C-terminal domains are shown in green and blue, respectively, and hydrophobic patches are in yellow. Arg141–Arg149 stretch is coloured as black. ‘L’ denotes positions of ionic locks. (a) Left, outward partially occluded conformation (Mol-A); right, threading model for inward conformation. (b) Residues forming ionic locks are shown in sticks connected by broken lines. Grey spheres represent the residues involved in sugar binding. (c) Cys mutant of Arg residue at position 295, 141 or 363. Intact E. coli DW2 cells containing WT MelBSt or a given mutant were assayed for [3H]melibiose transport (0.4 mM, 10 mCi mmol−1) in the absence or presence of 20 mM NaCl or LiCl. Intracellular melibiose expressed as nmol mg−1 of total proteins is plotted as a function of time. Each single-site mutation is in the WT background. Error bar, s.e.m., n=2 for the mutants and n=3 for the WT. (d) Western blotting. Twenty-five micrograms of RSO vesicles was loaded on each well and detected by anti-His-tag antibody.

