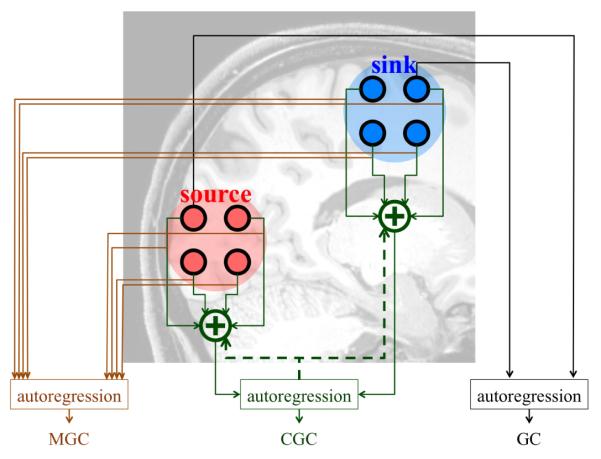
Figure 1.
We want to estimate the causality from the source region to the sink region via the time series recordings (represented by dark circles) from each region. GC analyzes the causality between pairs of recordings using univariate and bivariate autoregressive models. MGC fits much larger parametric autoregressive models to collections of time series. CGC parsimoniously represents each ROI using a single signal formed through an optimized weighted linear combination of signals from the ROI. CGC then applies standard GC analysis to these parsimonious representations.

