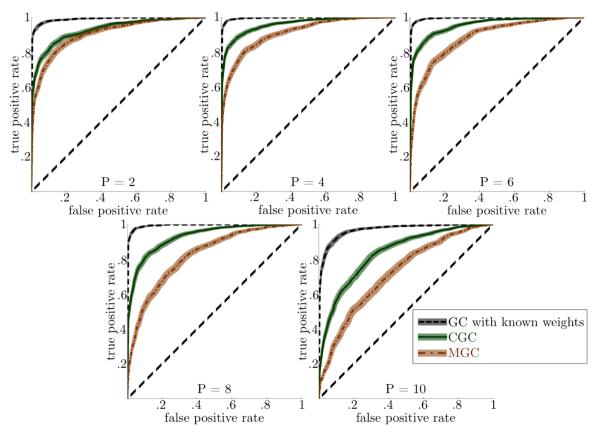
Figure 2.
CGC has a higher true positive rate for a given false positive rate than MGC. The dark lines are the mean ROCs, with the shadows indicating the 95% confidence intervals after bootstrapping. Knowing the true weights is better than CGC because CGC has an upward bias in the condition of no causality due to its maximization procedure, but such weights are not known in most practical applications.

