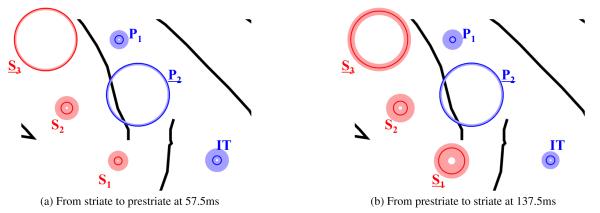
Figure 7.

Most of the causality in both timepoints of interest are driven by the relationship between two recording sites: S 3 and P2. The main plot shows the relative magnitude of the weight estimated for each channel; the larger the circle radius, the larger the magnitude of the weight for that channel. The dark line shows the mean magnitude of the weight over the full set of trials, while the shaded region shows the bootstrapped confidence interval. The analysis also indicates that S 1 has a higher weight in causality from prestriate to striate at 137.5ms than from striate to prestriate at 57.5ms.
