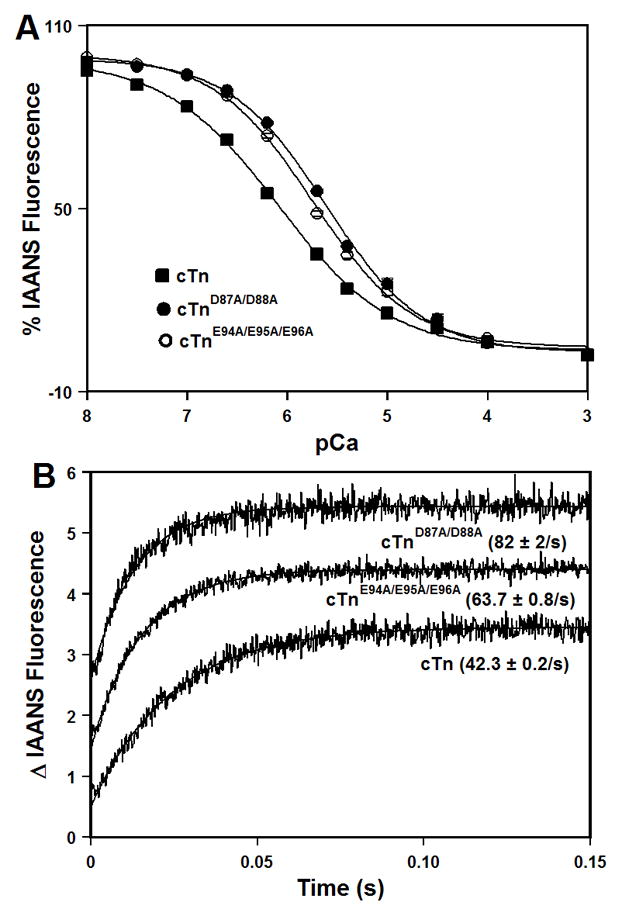
Figure 4. Effect of the central helix mutations on the Ca2+ binding properties of the cTn complex.

Panel A shows decreases in IAANS fluorescence, which occur as Ca2+ binds to the cTn (■), cTnD87A/D88A (●), or cTnE94A/E95A/E96A (○) complexes at 15°C. The cTnC proteins (with C35S/T53C/C84S substitution) were labeled with IAANS at Cys53. The IAANS fluorescence was excited at 330 nm and monitored at 450 nm. Panel B shows the time course of increases in IAANS fluorescence as Ca2+ was removed by excess EGTA from the cTn, cTnD87A/D88A, or cTnE94A/E95A/E96A complexes at 15°C. The data traces have been normalized and staggered for clarity. Each trace is an average of at least five traces fit with a single exponential equation. The IAANS fluorescence was excited at 330 nm and monitored through a 510 nm band-pass filter.
